Main takeaways
- Kubernetes HPA scales based on CPU or memory utilization after traffic spikes, not before. This reactive model causes latency spikes during predictable traffic patterns (daily peaks, jobs, etc.).
- HPA and VPA conflict when resource requests change, creating unstable replica counts and the Kubernetes “death spiral”.
- ScaleOps eliminates this instability with coordinated rightsizing and proactive replica optimization that pre-warms capacity and stabilizes scaling behavior
The Promise vs. Reality of HPA
HPA is the most deployed autoscaler in Kubernetes. It’s also architecturally limited in ways that matter for production workloads.
The design is straightforward: HPA monitors resource utilization, compares it against a target threshold, and adjusts replica counts accordingly. Set averageUtilization: 70, and HPA scales your deployment when CPU usage crosses that line.
apiVersion: autoscaling/v2
kind: HorizontalPodAutoscaler
metadata:
  name: my-app
spec:
  scaleTargetRef:
    apiVersion: apps/v1
    kind: Deployment
    name: my-app
  minReplicas: 2
  maxReplicas: 20
  metrics:
  - type: Resource
    resource:
      name: cpu
      target:
        type: Utilization
        averageUtilization: 70
This works well for static workloads with predictable traffic and unchanging resource requests. The problems emerge when you move beyond that baseline, which every production cluster eventually does.
HPA has three architectural limitations that compound in production environments:
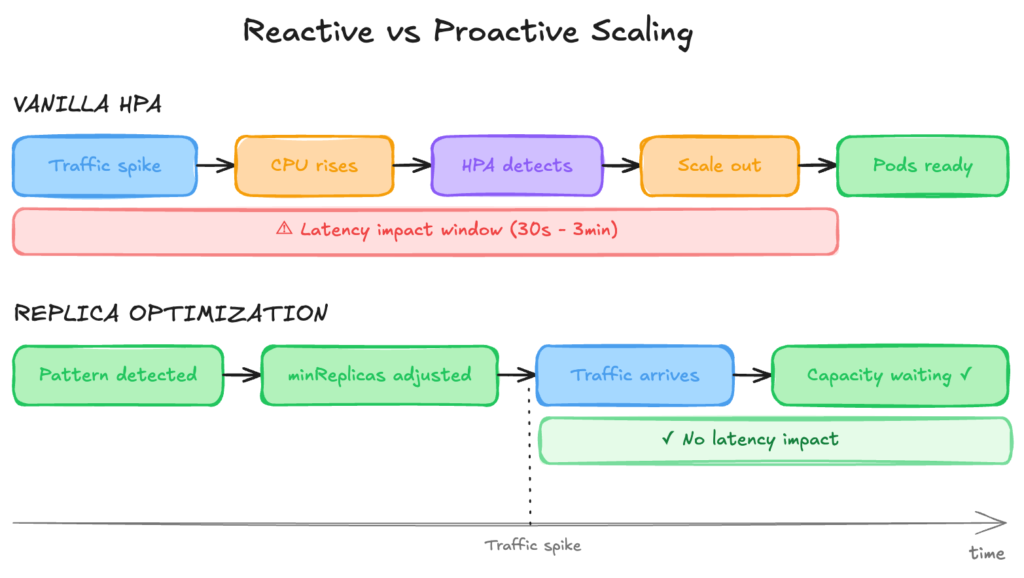
First, HPA is purely reactive.
It scales based on observed symptoms (elevated CPU) rather than anticipated demand. Traffic arrives, CPU rises, metrics-server collects (up to 60 seconds later), HPA detects the threshold breach, then initiates scaling. By the time new pods pass readiness probes, users have already experienced degraded latency. Predictable patterns — Monday morning spikes, lunch rush traffic, end-of-month processing — trigger the same reactive scramble every time, even though the pattern is entirely foreseeable from historical data.
Second, HPA’s percentage math breaks when requests change.
The averageUtilization target calculates against resources.requests.cpu, not actual node capacity. When you rightsize, whether manually, via VPA, or through optimization tooling, the denominator in HPA’s calculation shifts. A pod using 150m CPU with 200m requests shows 75% utilization. Drop requests to 100m (a reasonable optimization), and the same 150m usage becomes 150% utilization. HPA interprets this as an emergency and scales out aggressively, even though actual resource consumption hasn’t changed.
Third, VPA’s histograms get polluted when HPA scales.
VPA maintains per-container usage histograms to inform rightsizing recommendations. When HPA adds replicas, load spreads across more pods, and per-pod utilization drops. VPA’s histogram sees “lower usage” and recommends smaller requests. Smaller requests trigger the percentage math problem. The loop accelerates: this is the documented VPA/HPA “death spiral” that Kubernetes upstream explicitly warns against.
These three issues don’t exist in isolation. They feed each other: reactive scaling amplifies the percentage math problem during traffic spikes, histogram pollution degrades recommendations over time, and the combination creates oscillating, unpredictable autoscaler behavior.
Throughout this article, we’ll use TaxiMetrics as our demonstration workload—a representative microservices application that exhibits these scaling pathologies under realistic traffic patterns. We’ll examine each flaw in detail, then show how ScaleOps’ Replica Optimization addresses all three as a unified system.
Flaw #1: HPA is Always Late
HPA operates on a fundamental architectural constraint: it scales based on observed resource utilization, not anticipated demand. This reactive model means scaling decisions always lag behind the events that trigger them.
The Metrics Pipeline
Understanding why HPA is late requires tracing the metrics pipeline:
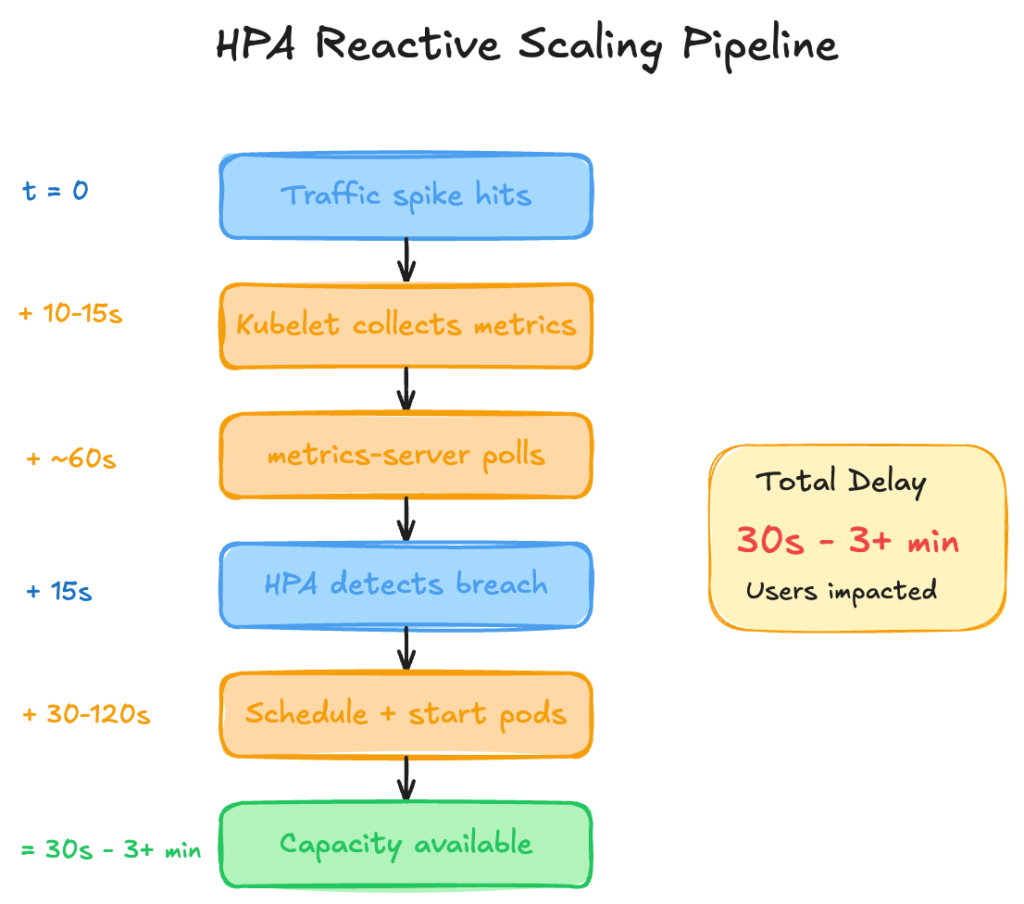
The cumulative delay from traffic spike to available capacity ranges from 30 seconds (best case: images cached, fast startup) to 3+ minutes (cold nodes, large images, slow readiness probes). During this window, existing pods absorb the full load increase, often resulting in elevated latency, throttling, or dropped requests.
Symptom-Based Scaling
The core issue is that HPA scales on symptoms rather than causes:
| Signal Type | Example | When HPA Sees It |
| Cause | Traffic increases 3x | Never (HPA doesn’t monitor traffic) |
| Symptom | CPU utilization hits 85% | 30-60 seconds after traffic spike |
By the time CPU rises enough to trigger scaling, the traffic spike has already impacted user experience.
Predictable Patterns, Repeated Panic
Most production traffic patterns are predictable. Business applications exhibit clear seasonality:
| Pattern | Frequency | Data Available |
| Monday morning spike | Weekly | Months of historical data |
| Lunch rush | Daily | Repeats every 24 hurs |
| End-of-month processing | Monthly | Predictable to the day |
| Seasonal peaks (Black Friday, Holidays, etc.) | Annually | Years of historical data |
HPA ignores all of this. It has no mechanism to learn from historical patterns or pre-warm capacity before predictable demand. Every Monday morning is treated as a novel event, triggering the same reactive scaling, even when the pattern has repeated for years.
The Over-Provisioning Tax
Teams recognize that HPA’s reactive nature creates reliability risk, which leads them to compensate with one of these mechanisms:
| Strategy | Trade-off |
Set minReplicas artificially high | Paying for idle capacity 24/7 |
| Over-provision resource requests | Wasted compute, poor bin-packing efficiency |
| Disable HPA, use fixed replica counts | No elasticity, always provisioned for peak |
| Accept latency degradation during scaling | SLA impact, degraded user experience |
Each approach trades cost for reliability (or accepts reliability degradation). None addresses the underlying architectural limitation.
With TaxiMetrics, we observe this pattern consistently: traffic spikes that are entirely predictable from historical data still trigger reactive scaling, with P99 latency spiking during the 30-90 second window before new pods become available.
Flaw #2: The Percentage Math Problem
HPA’s targetAverageUtilization setting appears straightforward: set 70%, and HPA maintains utilization around that level. The implementation details matter.
How HPA Calculates Utilization
The averageUtilization metric calculates against resources.requests.cpu, not node capacity or container limits:
utilization = (current CPU usage) / (CPU requests) × 100
This means the denominator in HPA’s calculation is whatever value exists in your pod’s resource requests at that moment.
apiVersion: autoscaling/v2
kind: HorizontalPodAutoscaler
metadata:
  name: taximetrics-api
spec:
  scaleTargetRef:
    apiVersion: apps/v1
    kind: Deployment
    name: taximetrics-api
  minReplicas: 2
  maxReplicas: 20
  metrics:
  - type: Resource
    resource:
      name: cpu
      target:
        type: Utilization
        averageUtilization: 70  # Calculated against requests, not capacity
The Math Breakdown
Consider a pod with stable resource consumption:
| Metric | Before Rightsizing | After rightsizing |
| CPU Requests | 200m | 100m |
| Actual Usage | 150m | 150m (unchanged) |
| Utilization | 150 ÷ 200 = 75% | 150 ÷ 100 = 150% |
| HPA Response | Stable (below 80% target) | Scale out immediately |
The workload hasn’t changed: the amount of traffic is identical and the actual CPU consumption is the same 150 millicores. But HPA’s percentage calculation shifted because the denominator changed.
With a 70% target, HPA calculates desired replicas using:
desiredReplicas = ceil(currentReplicas × (currentUtilization / targetUtilization))
Before rightsizing: ceil(2 × (75 / 70)) = ceil(2.14) = 3 replicas
After rightsizing: ceil(2 × (150 / 70)) = ceil(4.28) = 5 replicas
Same workload, same traffic, but HPA now wants 5 replicas instead of 3.
When This Happens
This behavior triggers whenever resource requests change:
- VPA in Auto mode: VPA applies new requests, pods restart, HPA recalculates against new denominator
- Manual rightsizing: Engineering adjusts requests based on observed usage
- Optimization tooling: Any system that modifies
resources.requests
The severity depends on how significantly requests change. A workload over-provisioned at 500m requests but using 150m would show 30% utilization. Rightsizing to 200m requests jumps utilization to 75%. Rightsizing further to 100m jumps to 150%.
The Documented Anti-Pattern
Kubernetes documentation explicitly warns against running VPA and HPA on the same resource metric. The controllers lack coordination because VPA modifies requests based on historical usage, while HPA scales based on current utilization percentage. When VPA changes requests, HPA’s math changes underneath it.
The standard workaround is to choose one:
- Use HPA for horizontal scaling, accept inaccurate resource requests
- Use VPA for rightsizing, disable HPA or use custom metrics
Neither option provides both accurate resource requests and stable horizontal scaling.
Flaw #3: The Histogram Aggregation Problem
The previous two flaws (reactive scaling and percentage math) create problems independently. This third flaw compounds them into a feedback loop.
How VPA Builds Recommendations
VPA uses historical usage data to recommend resource requests. For CPU, it maintains a decaying histogram of usage samples per container. The recommendation algorithm analyzes this histogram to suggest requests that would satisfy a target percentile (typically P90 or P95) of observed usage.
The key architectural detail: VPA collects samples per container, not per workload. Each pod’s container contributes individual data points to the histogram.
The Pollution Mechanism
When HPA scales a deployment from 2 to 4 replicas, the total workload remains constant but distributes across more pods:
| State | Replicas | Total Load | Per-Pod Load |
| Before scale-out | 2 | 300m CPU | 150m each |
| After scale-out | 4 | 300m CPU | 75m each |
VPA’s histogram now receives samples showing 75m usage per container instead of 150m. Over time, these lower samples shift the histogram distribution downward.
VPA’s recommendation logic sees “historical usage is lower” and recommends reduced requests, even though the workload’s total resource consumption hasn’t changed.
The Feedback Loop
This histogram pollution connects directly to Flaw #2 (percentage math):
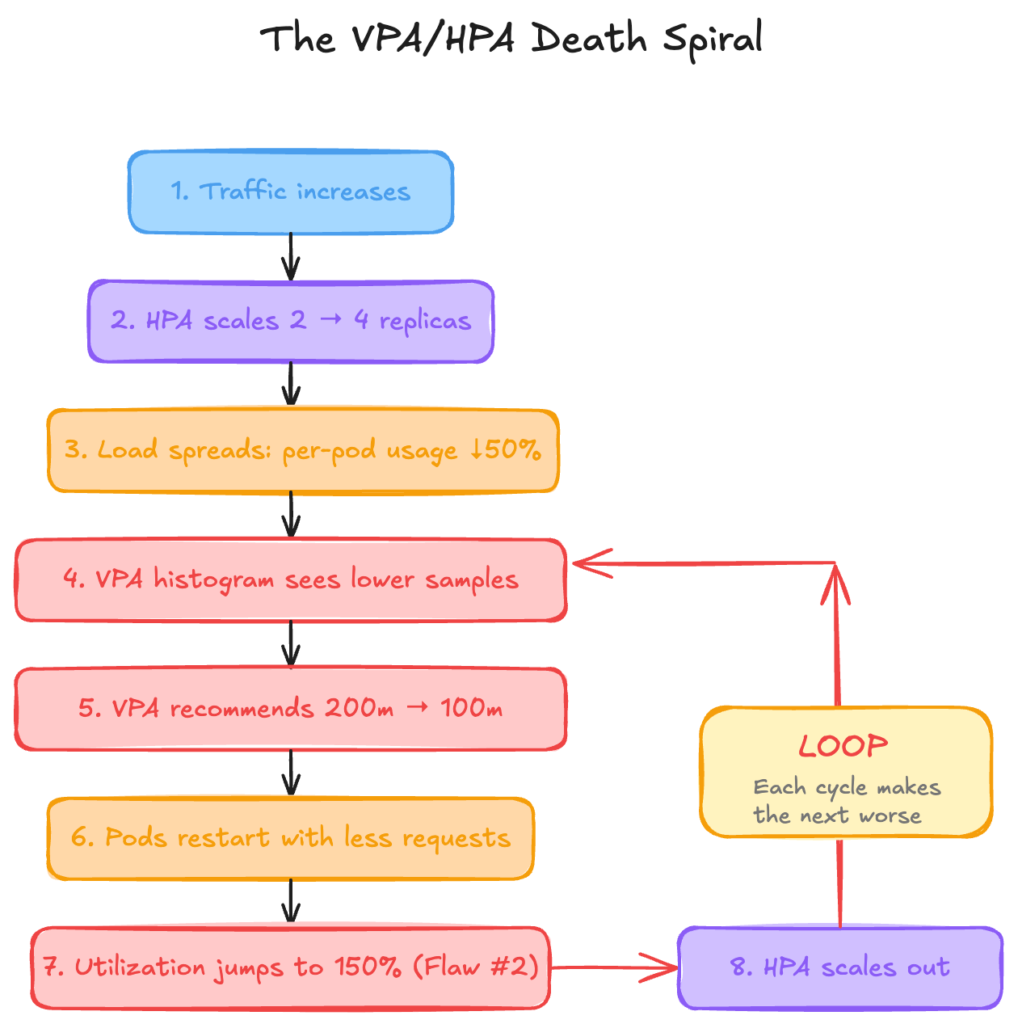
Each iteration accelerates the next. VPA continuously recommends smaller requests because the histogram data is polluted by HPA’s scaling decisions. HPA continuously scales out because VPA’s request changes break the percentage math.
The Inverse Problem
The loop also operates in reverse during scale-down:
- Traffic decreases, HPA scales from 4 → 2 replicas
- Load concentrates: per-pod usage doubles
- VPA histogram sees higher samples, recommends larger requests
- Larger requests reduce utilization percentage
- HPA sees low utilization, scales down further
- Oscillation between over-provisioned and under-provisioned states
Why This Is Documented as an Anti-Pattern
Kubernetes VPA documentation explicitly states that running VPA and HPA on the same CPU or memory metric should not be used. The controllers operate independently with no coordination mechanism:
- VPA modifies requests based on per-container historical data
- HPA modifies replica count based on current aggregate utilization
- Neither is aware of the other’s actions or their downstream effects
The standard guidance is to use HPA with custom or external metrics (queue depth, requests per second) while VPA manages resource requests. This separation prevents the feedback loop but requires additional metrics infrastructure.
ScaleOps Replica Optimization: The Unified Solution
The three flaws described above share a root cause: HPA and VPA operate independently with no coordination mechanism. ScaleOps addresses this through two integrated capabilities: Rightsizing (continuous resource request optimization) and Replica Optimization (horizontal scaling).
Flaw #1 Solved: Proactive Scaling
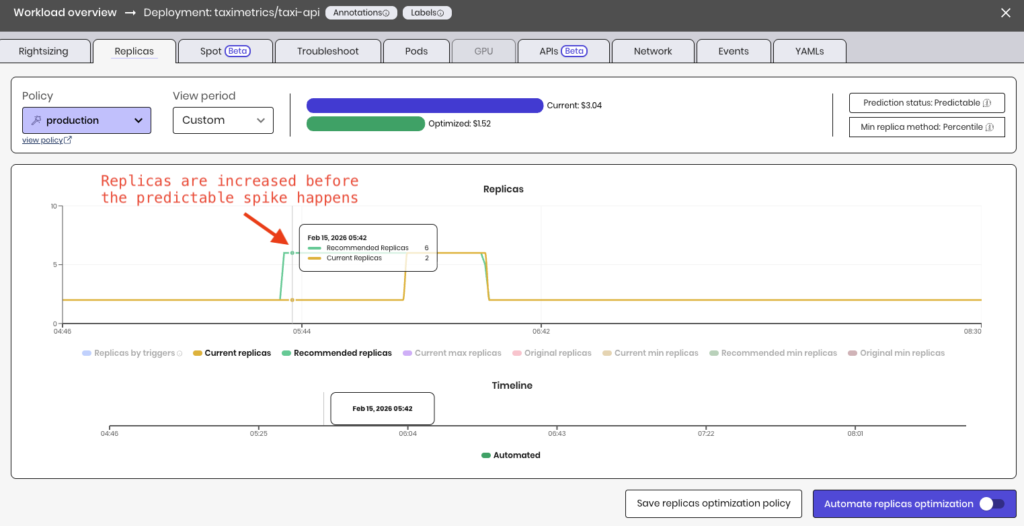
Standard HPA reacts to observed metrics. ScaleOps Replica Optimization takes a different approach: it replaces the static, manually-set minReplicas with a data-driven, continuously-updated value — lower when you’re over-provisioned, higher when a spike is coming.
| Scenario | Vanilla HPA | With Replica Optimization |
| Monday morning spike | Scales after CPU rises, 30s-3min delay | minReplicas pre-warmed before spike |
| Daily lunch rush | Same reactive pattern every day | Pattern detected, capacity ready |
| End-of-month processing | Treats predictable spike as surprise | Historical baseline informs scaling floor |
When seasonality patterns are detected, Replica Optimization adjusts minReplicas before traffic arrives. Pods are running and ready when users show up.
Replicas remain stable after Rightsizing event:
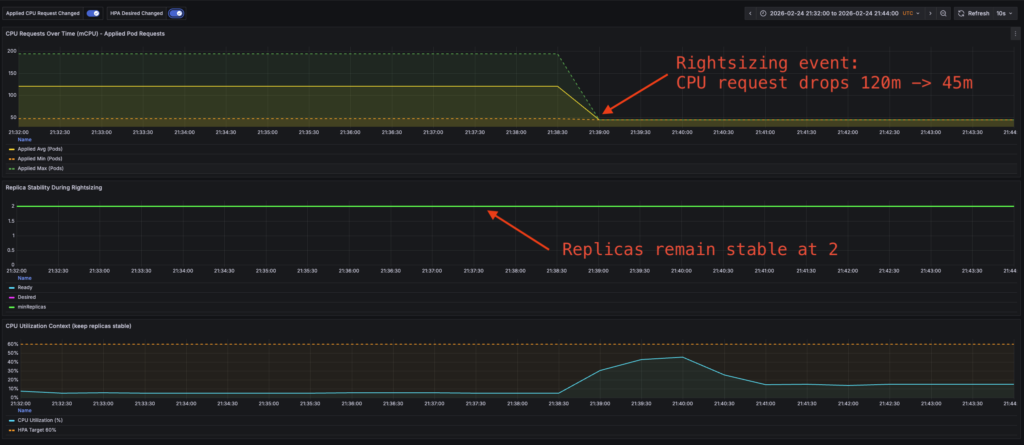
Flaw #2 Solved: Stable Scaling Through Rightsizing
When ScaleOps Rightsizing adjusts resource requests, Replica Optimization maintains consistent scaling behavior.
| Scenario | Vanilla HPA | With Replica Optimization |
| Rightsizing reduces requests 200m → 100m | Utilization spikes to 150%, panic scaling | Scaling behavior unchanged |
| Manual request tuning | Unpredictable replica fluctuations | Consistent scaling response |
| Continuous optimization | Restart storms, oscillation | Requests and replicas managed in coordination |
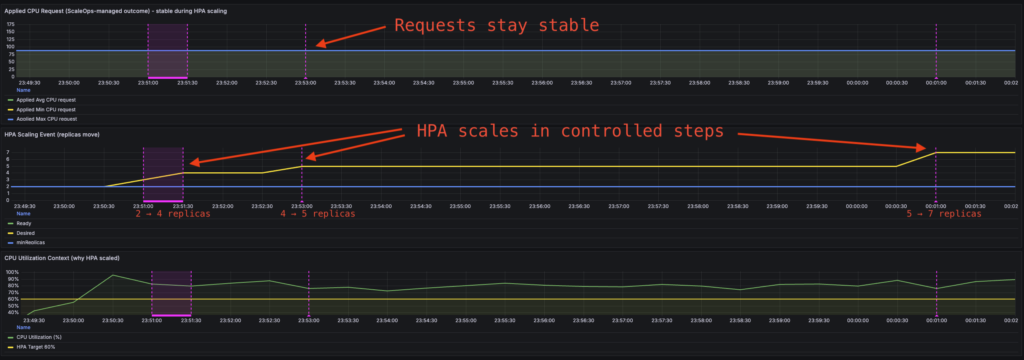
The scaling intent — “scale when the workload needs more capacity” — remains stable regardless of what values exist in resources.requests. Request changes don’t trigger spurious scaling events.
Flaw #3 Solved: Accurate Recommendations Despite Scaling
ScaleOps Rightsizing analyzes resource consumption at the workload level, not per-container.
| Scenario | Vanilla VPA | With ScaleOps Rightsizing |
| HPA scales 2 → 8 replicas | Histogram sees 75% less per-pod usage, recommends smaller requests | Recommendations stay stable |
| Traffic spike + scale out | Histogram skewed by temporary pod distribution | Workload profile stays accurate |
| Scale down after peak | Oscillating recommendations | Consistent sizing through all phases |
Replica count changes don’t pollute the data used for rightsizing recommendations. Whether the workload runs on 2 pods or 20, the recommendation reflects actual resource requirements.
The Unified System
These capabilities work together rather than as independent fixes:
- Rightsizing optimizes resource requests based on actual workload behavior
- Replica Optimization maintains stable horizontal scaling regardless of request values
- Seasonality detection pre-warms capacity before predictable demand
This means resource requests reflect actual usage, horizontal scaling responds to real capacity needs, and predictable traffic patterns don’t cause repeated reactive scrambles.
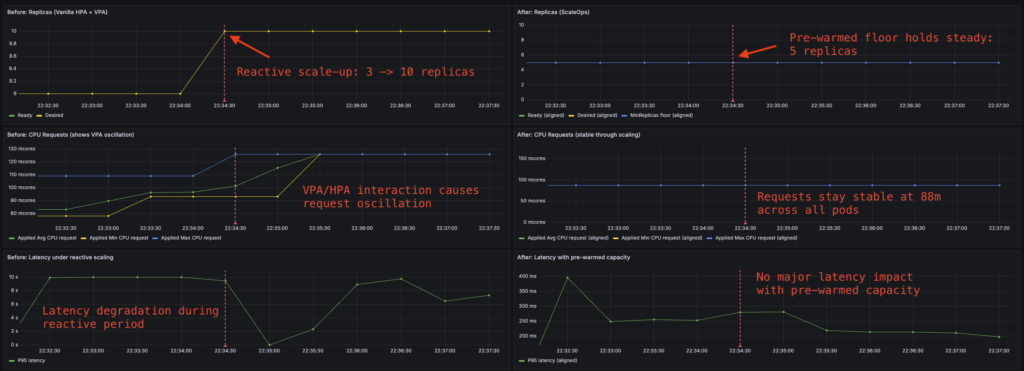
TaxiMetrics: Before and After
Applying ScaleOps to the TaxiMetrics deployment demonstrates the difference:
Before (vanilla HPA + VPA):
- Rightsizing event triggers replica spike from 3 → 7
- VPA recommendations oscillate as HPA scales
- Scheduled batch causes 45-second latency degradation while pods start
After (ScaleOps Rightsizing + Replica Optimization):
- Rightsizing event: replica count unchanged
- Recommendations stable through scaling events
- capacity pre-warmed for scheduled batch, no latency impact
Comparison of replicas, CPU requests and latency before and after ScaleOps:
Predictive Replica Optimization with ScaleOps:
Practical Implementation
Migration Path
ScaleOps is production-grade and scale-ready from day one. The typical adoption path:
Phase 1: Read-Only Mode
Enable both Rightsizing and Replica Optimization in read-only mode. No changes are applied to workloads: ScaleOps observes, analyzes, and generates optimization opportunities.
This phase reveals the gaps in current autoscaling (vertical and horizontal) behavior:
| Metric | What You’ll See |
| Recommended vs. actual requests | How far current requests are from optimal |
| Recommended vs. actual minReplicas | The seasonality gap — where Replica Optimization would pre-warm capacity |
| Predicted scaling events | When ScaleOps would have adjusted before traffic arrived |
The seasonality gap is particularly valuable: you can observe the time difference between when Replica Optimization would adjust minReplicas versus when your current HPA actually reacts. In automated mode, these align. But in read-only mode, the gap quantifies the latency impact you’re currently absorbing.
Phase 2: Automate
Once you’ve validated the recommendations match observed workload behavior, enable automation with one click. Rightsizing and Replica Optimization begin applying changes, and the gaps close.
No phased rollout required. No canary deployments of autoscaler configurations. The same system that generated accurate recommendations in read-only mode now applies them.
What’s Next: The Metrics Latency Problem
ScaleOps Replica Optimization addresses the death spiral: stable scaling through rightsizing, accurate recommendations despite replica changes, and proactive capacity management for predictable patterns.
But HPA has another architectural limitation that exists regardless of how you configure it: metrics latency.
The Metrics Pipeline
HPA relies on metrics-server for resource utilization data. The pipeline introduces cumulative delay:
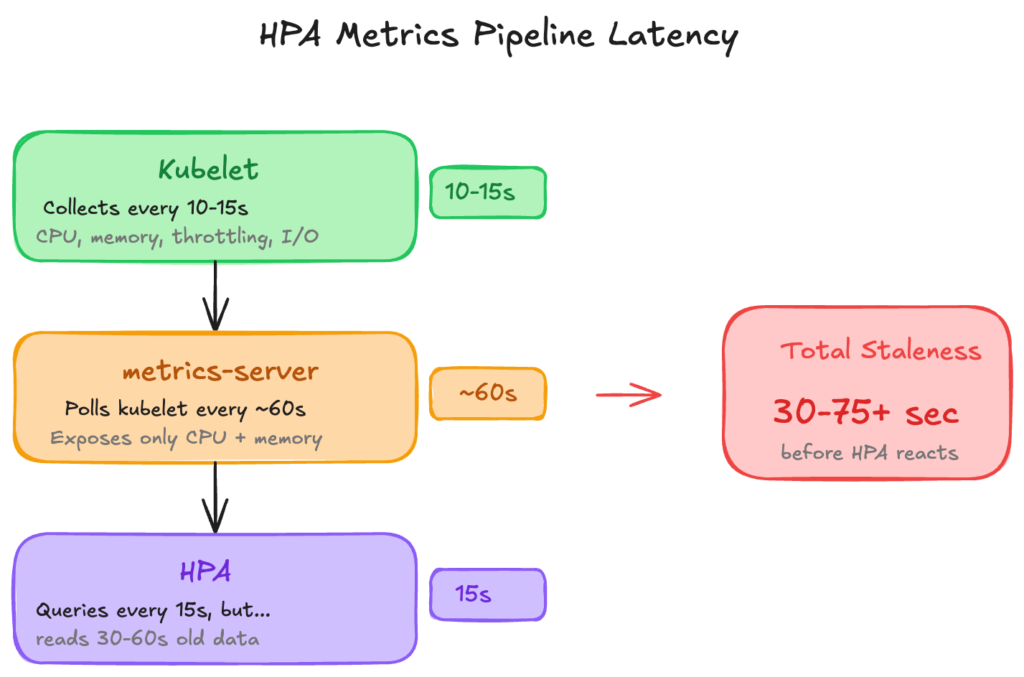
The Limitation
For workloads where CPU and memory are accurate proxies for load, this pipeline works. For workloads where they aren’t (queue processors, latency-sensitive APIs, batch jobs with variable resource profiles) HPA scales on lagging indicators that don’t reflect actual capacity needs.
| Workload Type | Useful Scaling Metric | Available via metrics-server |
| API service | Request latency, error rate | No |
| Queue processor | Queue depth, processing rate | No |
| CPU-bound batch | CPU throttling ratio | No |
| Memory-sensitive | Memory pressure, eviction signals | No |
KEDA: A Different Approach
KEDA (Kubernetes Event-Driven Autoscaler) addresses this by querying metrics sources directly — Prometheus, cloud provider APIs, message queues — with configurable polling intervals as low as 15 seconds.
# KEDA ScaledObject example
apiVersion: keda.sh/v1alpha1
kind: ScaledObject
metadata:
  name: taximetrics-api
spec:
  scaleTargetRef:
    name: taximetrics-api
  pollingInterval: 15
  triggers:
  - type: prometheus
    metadata:
      query: sum(rate(http_requests_total{app="taximetrics"}[1m]))
      threshold: "100"
No metrics-server in the path. No 60-second staleness. Scale on the metrics that actually indicate whether your application needs more capacity.
The Metrics Question
This points to a broader architectural question that the Kubernetes community is still working through: what should autoscaling actually respond to?
CPU and memory are lagging indicators. By the time CPU spikes, the queue is already backing up. By the time memory pressure appears, the OOM killer is already circling. You’re scaling based on symptoms, not causes — driving by looking in the rearview mirror.
Leading indicators tell a different story:
| Lagging (HPA default) | Leading (requires custom metrics) |
| CPU utilization % | CPU throttling ratio |
| Memory usage | Memory pressure, eviction signals |
| Queue depth | Queue depth + growth rate |
| Average latency | P99 latency, error rate |
The metrics-server design is a deliberate trade-off. Kubernetes chose simplicity and universal compatibility over metric richness. Every cluster has CPU and memory. Not every cluster has Prometheus, or application-level instrumentation, or the operational maturity to define meaningful custom metrics.
But if you’re running production workloads at scale, you’ve probably already crossed that threshold. The question becomes: are you using metrics that actually predict capacity needs, or just reacting to resource exhaustion?
KEDA opens the door to leading metrics. ScaleOps Replica Optimization adds the intelligence layer with pattern detection, seasonality, and proactive scaling. But the fundamental shift is the same: moving from “scale when it hurts” to “scale before it matters.”
Next in This Series
This article covered HPA’s architectural limitations when combined with rightsizing — reactive scaling, percentage math instability, and histogram pollution — and how ScaleOps Rightsizing and Replica Optimization address them as a unified system.
But for workloads where CPU and memory aren’t accurate proxies for capacity needs, there’s a deeper question: should you be using HPA at all?
The next article explores KEDA in depth:
- KEDA vs HPA + Prometheus Adapter — architecture, complexity, and failure modes
- When to use which — decision framework by workload type
- How ScaleOps integrates with event-driven scaling — combining KEDA with intelligent rightsizing
If your scaling decisions depend on queue depth, request latency, or custom application metrics, that’s the one to read.
Ready to see ScaleOps in action? Experience how Rightsizing and Replica Optimization eliminate the HPA/VPA death spiral — with read-only mode to validate before you automate.
FAQ: Kubernetes HPA, VPA, and Autoscaling Stability
Why is Kubernetes HPA considered reactive?
HPA scales based on observed CPU or memory utilization after traffic increases. Because it relies on metrics-server updates and pod readiness time, scaling decisions are delayed, which can cause temporary performance degradation during traffic spikes.
Why do HPA and VPA conflict in Kubernetes?
HPA calculates scaling decisions using a percentage of CPU or memory requests. When VPA adjusts those requests, the utilization percentage changes instantly—even if workload demand does not. This can trigger unnecessary replica scaling and instability.
What is the Kubernetes HPA/VPA “death spiral”?
The death spiral occurs when HPA scales replicas and VPA adjusts resource requests independently. Replica changes distort per-pod metrics, leading VPA to recommend smaller requests, which in turn causes HPA to scale further. This creates oscillating and unstable scaling behavior.
How can vertical and horizontal Kubernetes autoscaling be stabilized?
Autoscaling stability requires coordination between resource rightsizing and replica scaling. A unified system that analyzes workload-level consumption and adjusts replicas proactively—rather than reacting to CPU spikes—prevents scaling loops and reduces latency.
When should you use KEDA instead of HPA?
KEDA is better suited for workloads that require scaling based on leading indicators such as queue depth, request rate, or latency. Unlike HPA’s default CPU-based scaling, KEDA can scale on custom or event-driven metrics with lower latency.