Static replica counts are a gamble you can’t win. You either overprovision and burn cash on oversized pods, or you underprovision and risk cascading failures during traffic spikes. For any production system running on Kubernetes, dynamic autoscaling is a key discipline for achieving both reliability and cost efficiency.
Mastering Kubernetes autoscaling is a journey of increasing maturity, one that often starts with a single, powerful command: kubectl autoscale. It’s the fastest and most direct way to add elasticity to a deployment, delivering an immediate win. But while this command is the front door to a more intelligent system, production-grade automation requires moving beyond that first step toward a more declarative and robust strategy.
This guide walks you through that entire maturity journey, from your first CLI command to a fully autonomous scaling strategy, equipping you with the tools to build a truly resilient and cost-efficient platform.
The First Step: Quick Wins with kubectl autoscale
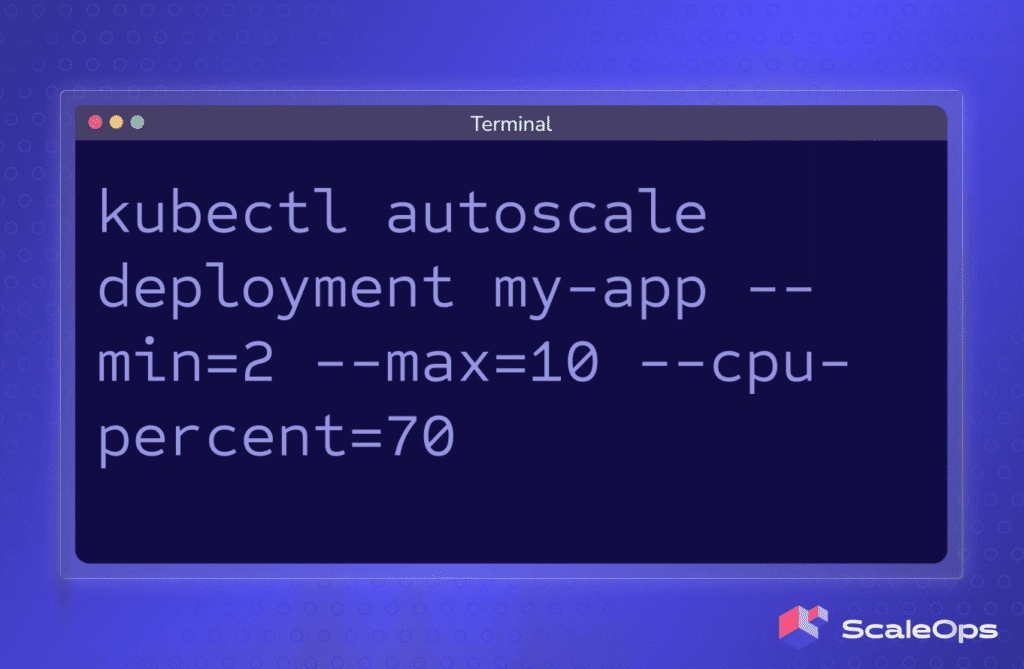
The fastest way to enable autoscaling and see immediate results is with the kubectl autoscale command. Without writing a single line of YAML, you can give a deployment the elasticity it needs to handle variable load.
Here is the command:
kubectl autoscale deployment my-webapp --min=2 --max=10 --cpu-percent=75This single line instructs Kubernetes to create a Horizontal Pod Autoscaler (HPA) resource. The HPA controller will monitor the my-webapp deployment and automatically adjust its replica count to keep the average CPU utilization across all its pods at around 75%.
The command is governed by three critical flags:
--cpu-percent=75: This is your target. HPA will add or remove pods to maintain this average utilization across the deployment.--min=2: This is your availability floor. It sets the minimum number of replicas, ensuring you never scale down to a single point of failure.--max=10: This is your cost-control ceiling. It sets the maximum number of replicas, preventing a runaway scaling event from consuming excessive resources.
In seconds, you’ve moved from a static, fragile configuration to a dynamic, resilient one. This is the first and most impactful step on the path to production-ready autoscaling.
The Production Baseline: Declarative HPAs in GitOps
The kubectl autoscale command is spot-on for discovery and testing, but it’s an imperative command. A one-time instruction that tells the cluster to do something. Production systems, however, require a declarative approach. Your infrastructure’s desired state, including its scaling policies, must be defined as code and stored in a version control system like Git. This is the core principle of GitOps.
Instead of running a command, you define an HPA resource in a YAML file. This manifest is the source of truth for your scaling policy.
apiVersion: autoscaling/v2
kind: HorizontalPodAutoscaler
metadata:
  name: my-webapp-hpa
spec:
  # Point HPA at the deployment it needs to scale
  scaleTargetRef:
    apiVersion: apps/v1
    kind: Deployment
    name: my-webapp
  # Define the scaling boundaries
  minReplicas: 2
  maxReplicas: 10
  # Define the metric to scale on
  metrics:
  - type: Resource
    resource:
      name: cpu
      target:
        type: Utilization
        averageUtilization: 75
It is then applied to your cluster as part of your standard deployment process. This declarative, GitOps-friendly approach is the non-negotiable baseline for production for several key reasons:
- Auditability: Every change to your scaling policy: who made it, why they made it, and when, is recorded in your Git history. This provides a complete audit trail for compliance and incident review.
- Consistency: The same HPA manifest can be applied to your development, staging, and production environments, ensuring your scaling behavior is consistent and predictable everywhere.
- Automation: The manifest becomes part of your standard CI/CD workflow. Scaling changes can be reviewed, approved, and rolled out through pull requests, just like any other code change, eliminating manual, error-prone commands.
The Operator’s Toolkit: Debugging and Verification
You can only trust automation that you can verify. When HPA doesn’t behave as you expect by scaling too slowly, too quickly, or not at all, knowing how to diagnose the issue is a critical operator skill. Kubernetes provides two essential commands for peeling back the layers and understanding HPA’s decision-making process.
The Quick Look: kubectl get hpa
Your first stop is a high-level status check. This command gives you a concise, one-line view of the current state: the target metric, the current value, and the number of replicas.
kubectl get hpa my-webapp-hpaYou’ll see output like this, which is perfect for a quick confirmation that HPA is active and receiving metric data.
NAME           REFERENCE	        TARGETS	 MINPODS  MAXPODS  REPLICAS  AGE
my-webapp-hpa  Deployment/my-webapp	30%/75%	 2	      10	   2	     5m
The Deep Dive: kubectl describe hpa
For a detailed diagnosis, kubectl describe hpa is your best friend. It provides a rich, multi-section output that reveals HPA’s entire thought process. Pay special attention to the Events section at the very bottom; it’s a chronological log of HPA’s observations and actions.
kubectl describe hpa my-webapp-hpaMost common problems can be diagnosed by reading these events. Here’s how to translate HPA’s messages into common “gotchas” and their fixes:
- No Metrics Available
- Symptom: The
TARGETScolumn inget hpashows<unknown>, and thedescribeevents log showsFailedGetResourceMetric. - Diagnosis: HPA is telling you it can’t find the CPU or memory data it needs. This almost always means the
metrics-serverisn’t installed or running correctly in your cluster. - Verification: Run
kubectl top nodes. If that command fails, you’ve found the root cause.
- Symptom: The
- Scaling Down is Too Slow
- Symptom: Your app scales up quickly, but after traffic disappears, it takes many minutes to scale back down.
- Diagnosis: This is usually not an error, but a feature. Kubernetes has a built-in stabilization window (defaulting to 5 minutes for scale-down) to prevent rapid, disruptive fluctuations. The event log will show the desired replica count dropping, but the actual rescale event won’t fire until the window passes. This is a configurable setting in the cluster, but the default prevents thrashing.
- Replicas are “Thrashing” (Flapping Up and Down)
- Symptom: The event log shows
SuccessfulRescaleevents happening frequently, cycling between a higher and lower replica count. - Diagnosis: HPA is too sensitive. This usually means your CPU target is too aggressive (e.g., set to 50% when the app naturally idles at 45%), causing it to constantly cross the threshold.
- Fix: Increase your
averageUtilizationtarget to a more realistic number (e.g., 70-75%) to create a larger buffer, or consider adjusting the stabilization window for your cluster.
- Symptom: The event log shows
The Tipping Point: From Manual Tuning to Autonomous Optimization
We have now reached the peak of what can be reasonably managed by hand. You understand the limits of the HPA’s reactive nature, you’ve seen how KEDA can help, and you’re aware of the VPA/HPA conflict. This new level of sophistication, however, introduces a new challenge: continuous, manual tuning.
At scale, this becomes an unsustainable operational burden for even the most skilled platform team. How do you make the HPA proactive? How do you solve the pod sizing dilemma without the risks of the standard VPA? The tipping point is when the time your team spends tuning the automation outweighs the benefits of the automation itself. This is the final step in the maturity journey: moving from human-managed automation to a truly autonomous system.
Introducing ScaleOps: Your Autonomous Scaling Engine
This is where an intelligent control plane becomes essential. Instead of replacing your existing tools, ScaleOps acts as an autonomous layer that directly solves the gaps in the native Kubernetes landscape.
- It makes your HPA proactive, not reactive. The standard HPA is powerful but only scales after your SLOs are already at risk. ScaleOps enhances your HPA with predictive intelligence, analyzing workload history to learn seasonal patterns. It anticipates demand before it hits, transforming HPA from a reactive safeguard into a predictive scaling engine.
- It solves the VPA/HPA dilemma safely. The standard VPA is too slow and disruptive for production, leaving you with the unsolved challenge of rightsizing your pods. ScaleOps provides continuous, SLO-aware rightsizing, acting as an intelligent VPA replacement. It safely and automatically adjusts pod resource requests based both on real-time and historical data. This ensures each pod is perfectly sized to work in harmony with HPA’s scaling decisions, eliminating the conflict.
Take the Next Step
Moving from manual tuning to an autonomous platform is the final step in the autoscaling maturity journey. When you’re ready to see how an intelligent control plane can transform your operations, here’s how to get started.
- Book a Personalized Demo: Schedule a session with our team. We’ll show you how ScaleOps can address your specific scaling challenges and provide a clear projection of the cost savings and performance gains you can expect.
- Start Your Free Trial: Deploy ScaleOps in your own environment in minutes. See firsthand how autonomous rightsizing and proactive scaling can eliminate tuning overhead and ensure your applications are always perfectly resourced.


