Three years ago, GPU infrastructure conversations centered on training. Organizations debated cluster sizes for model development, negotiated cloud quotas for research workloads, and treated inference as an afterthought—a lightweight deployment that followed months of training investment.
That ratio has inverted. McKinsey’s analysis of global data centre demand shows inference workloads growing at 35% year-over-year, on track to surpass training compute by 2030. The economics explain why: a model trains once but serves millions of requests. The infrastructure cost has shifted from building models to running them.
This shift brought a new operational pattern: scale-to-zero. GPU instances cost $2–32 per hour depending on capability. Keeping inference pods running continuously during off-peak hours—nights, weekends, regional low-traffic windows—burns budget on underutilized compute. Platform teams responded rationally by configuring autoscalers to terminate GPU pods when demand dropped and recreate them when requests returned.
The strategy works for CPU workloads, where pod startup takes seconds. For GPU inference, it introduced a problem that wasn’t visible at smaller model scales: cold starts measured in minutes.
For example, let’s take a fraud detection model deployed to Kubernetes that receives its first request of the morning. The pod requires a GPU. What follows is a cascade of sequential operations: the cluster autoscaler provisions a node, the container runtime pulls a multi-gigabyte image, model weights download from object storage, CUDA initializes its execution context, and weights transfer from system memory into GPU VRAM.
Eight minutes pass before the first inference completes. The GPU consumed resources for eight minutes. Requests processed: zero.
This scenario repeats with every scale-to-zero event, every region failover, every deployment rollout. The instinct is to treat it as a Kubernetes configuration problem—something fixable with better autoscaler settings or smarter pod scheduling. That framing misses what’s actually happening. GPU cold starts are physics problems. PCIe bandwidth constraints, CUDA context initialization, and memory architecture create hard floors that no orchestration layer can eliminate.
Understanding where those minutes go—and which techniques actually reduce them—requires examining the full startup sequence. We’ll cover four patterns: three you configure once, one that requires continuous attention, and how ScaleOps automates that last piece.
The Cold Start Waterfall
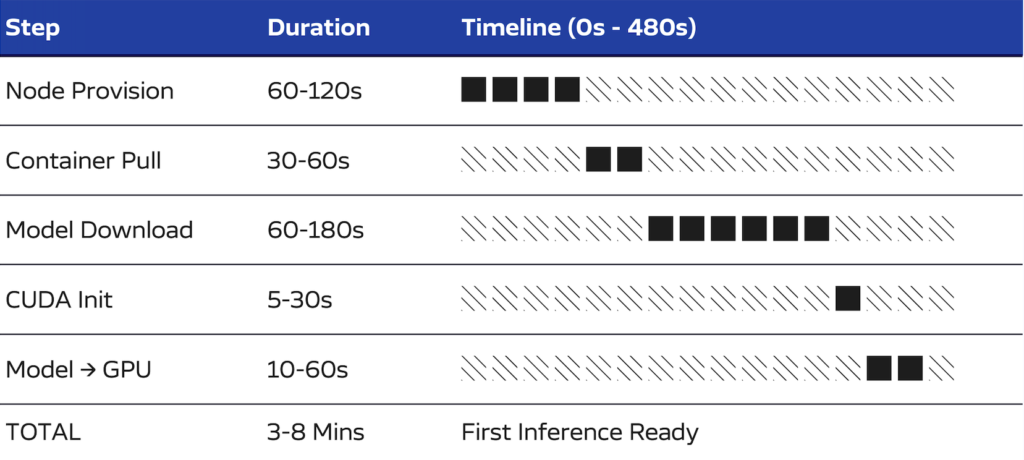
A cold start from scale-to-zero proceeds through five sequential stages. Each stage must complete before the next can begin. This sequential dependency is the core challenge: optimizing any single stage yields marginal improvement while the others remain unchanged.
1. Node Provisioning (60–120 seconds)
When no GPU node exists in the cluster, the autoscaler calls the cloud provider API. The hypervisor allocates resources, the VM boots, the operating system initializes, and the kubelet registers with the Kubernetes control plane. GPU instances require additional time beyond standard compute nodes—the NVIDIA driver must initialize and expose the device before Kubernetes can schedule GPU workloads.
2. Container Image Pull (30–60 seconds)
Inference server images carry significant weight. A typical deployment includes PyTorch or TensorFlow, CUDA runtime libraries, cuDNN, and the model serving framework. Image sizes range from 5 to 15 gigabytes. On a fresh node with no layer cache, the entire image transfers from the container registry. This stage often surprises teams who optimized their application containers to sub-gigabyte sizes, because the ML runtime dependencies dwarf application code.
3. Model Download (60–180 seconds)
The model weights must be retrieved from object storage. This is where the shift to larger models becomes visible in operations. Three years ago, a production model might have been 500 megabytes. Today, a 7 billion parameter model requires 14 gigabytes in FP16 precision, while a 70 billion parameter model exceeds 140 gigabytes. Transfer time depends entirely on network throughput between storage and pod—and that throughput is rarely the gigabit-per-second rates that cloud marketing suggests.
4. CUDA Context Initialization (5-30 seconds)
The CUDA runtime allocates GPU memory, loads the driver into the process address space, registers kernels, and establishes execution streams. This initialization occurs once per process, i.e. per container. The duration varies by GPU model, driver version, and the complexity of libraries being loaded. It’s worth noting that this happens even when another process on the same node has already initialized CUDA—contexts are per-process, not per-node.
5. Weight Transfer to GPU Memory (10–60 seconds)
Model weights land in system RAM after download, but inference requires them in GPU VRAM. That transfer crosses the PCIe bus at roughly 32 GB/s—a 14 GB model takes 1–2 seconds in practice. This is time you cannot optimize away. The PCIe bus is the only road in.
Total Duration: 3–8 minutes
Three to eight minutes might seem tolerable for a batch job. For inference, it’s catastrophic. Users expecting sub-second responses have long abandoned the request. The GPU ran for several minutes processing zero inferences — you paid for compute that served no one.
And this isn’t a one-time cost. It happens on every scale-from-zero event: Monday morning traffic ramp, post-deployment rollout, regional failover, every autoscaler decision to terminate an idle pod. Multiply by number of models, number of regions, number of daily scale events. Organizations running dozens of models across multiple clusters accumulate hours of daily cold start time — hours of GPU cost with zero throughput.
The sequential nature of this waterfall is the core problem. You cannot parallelize across stages; each depends on the previous. Optimizing any single stage yields marginal improvement while the others dominate.
Why GPU Architecture Creates These Constraints
When Kubernetes added GPU support via device plugins in version 1.8 (2017), the implicit assumption was that GPUs would behave like CPUs with more cores—schedule work to them, let the kernel handle resource sharing, move on. That assumption was reasonable for the GPU workloads of 2017. It breaks down for inference workloads in 2026.
The Memory Separation Problem
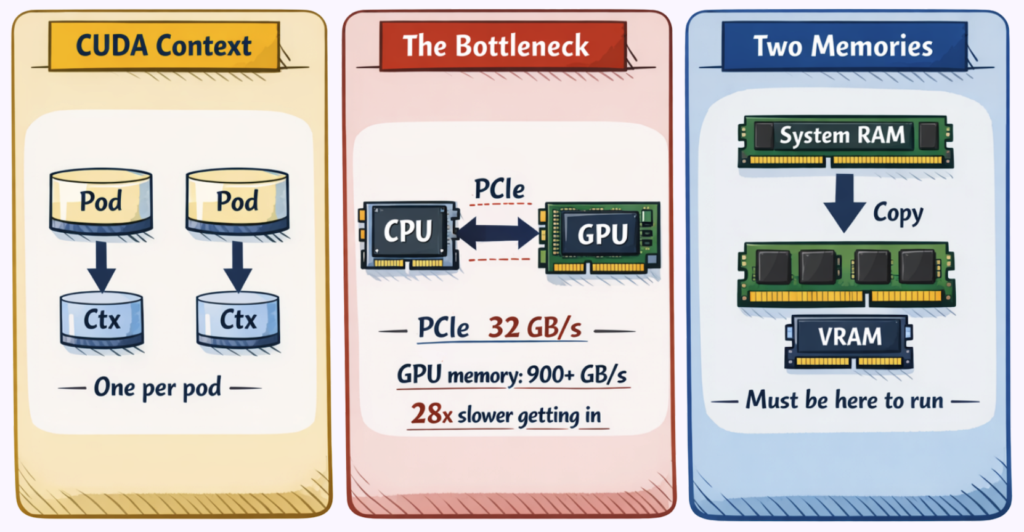
CPUs and GPUs maintain fundamentally distinct memory systems. The CPU accesses system RAM—DDR4 or DDR5 modules attached to the memory controller. The GPU accesses Video RAM, implemented as High Bandwidth Memory (HBM) stacked directly on the GPU package.
These memory spaces cannot directly address each other. A pointer valid in CPU address space has no meaning on the GPU. Unlike the unified memory model that programmers use for CPU applications, GPU programming requires explicit data movement between domains.
This separation is a performance tradeoff. HBM achieves its massive bandwidth by sitting directly on the GPU package—physical proximity is the entire point. System RAM, on the other hand, is separated by the PCIe bus, and pays the distance penalty.
The PCIe Bottleneck
The CPU and GPU communicate over the PCIe bus. PCIe 4.0 x16 provides approximately 32 gigabytes per second of bidirectional bandwidth—impressive compared to network speeds, but limiting compared to what happens inside the GPU:
| Component | Bandwidth |
| PCIe 4.0 x 16 (CPU ↔ GPU) | ~32 GB/s |
| A100 HBM2e (internal) | 2,039 GB/s |
| H100 HBM3 (internal) | 3,350 GB/s |
The disparity exceeds 60x. Once data resides in GPU memory, computation proceeds at HBM speeds. Matrix multiplications that would take seconds on CPU complete in milliseconds. But the road into the GPU via PCIe creates a bandwidth ceiling that no software optimization can raise.
This is why the “just preload into RAM” intuition fails. Weights in system RAM still need to cross PCIe to reach VRAM. Faster NVMe storage helps the download phase but doesn’t touch the final transfer.
The Per-Process Context Problem
CUDA contexts represent the most operationally significant architectural constraint for Kubernetes deployments. Each process that uses a GPU creates its own CUDA context—a collection of GPU virtual address space allocations, memory pools, registered kernels, and execution streams.
Contexts are not shared between processes. A node with a warm GPU and idle VRAM still requires full context initialization for every new pod. The GPU driver doesn’t know or care that another container already went through this process.
This design made sense for CUDA’s original use case: single-user workstations running one GPU application at a time. For containerized multi-tenant environments, it means that the “warm node” optimization that works for CPU pods—keeping a node ready with cached images—provides only partial benefit for GPU pods. The node is warm. The CUDA context is still cold.
These architectural realities inform which optimization approaches can work and which cannot. Several technologies appeared to address these constraints. The results have been instructive.
Technologies That Solve Different Problems

When GPU cold starts emerged as an operational pain point, teams naturally looked to existing GPU technologies for solutions. Several candidates appeared promising. Understanding why they don’t solve cold starts clarifies what actually will.
MPS: Designed for Utilization, Not Startup
Multi-Process Service allows multiple processes to share a single CUDA context and execute kernels concurrently on the same GPU. NVIDIA introduced MPS to address GPU utilization—when multiple small workloads each claimed a full GPU but used only a fraction of its compute capacity.
MPS improves utilization, but with constraints. All processes must coordinate within a single CUDA context on the same container—it’s not a Kubernetes-native mechanism. And each process still loads its own model weights into VRAM; the shared context reduces some per-process overhead, but model loading (the dominant cold start component) remains unchanged.
MIG: Designed for Isolation, Not Speed
Multi-Instance GPU partitions a physical GPU into isolated instances, each with dedicated streaming multiprocessors (SM) and memory. NVIDIA designed MIG for multi-tenant environments where workloads require hardware-level isolation and predictable performance.
MIG solves isolation. It does not reduce cold start time. Each partition maintains its own memory pool, and models cannot be shared across partitions. Each partition incurs its own weight transfer cost. So, when multiple MIG instances start simultaneously, aggregate cold start time may actually increase because the same PCIe bus serves more concurrent transfers.
There’s also an operational constraint: MIG partitioning is static. Changing the partition layout requires draining the node and rebooting—not something you can adjust dynamically based on workload mix.
Unified Memory: Designed for Programming Simplicity, Not Data Movement
Unified Memory provides a single address space accessible by both CPU and GPU. Pages migrate between system RAM and VRAM on demand, managed transparently by the CUDA runtime. NVIDIA introduced this feature to simplify GPU programming—developers could write code without explicit memory transfers.
Unified Memory changes when transfers happen, not whether they happen. This means pages still migrate over PCIe when first accessed by GPU code. The same bytes traverse the same bus. For inference workloads, on-demand page faults introduce latency spikes at unpredictable points during execution—often worse than the eager loading they replace.
The Pattern
Each of these technologies addresses a real operational problem: utilization, isolation, programming complexity. However, none addresses cold start latency because none changes the fundamental physics: PCIe bandwidth and per-process CUDA initialization.
Techniques that do reduce cold starts work differently. They either avoid triggering the cold start sequence or reduce the data volume that must traverse it.
Four Patterns That Actually Work
Four patterns address different stages of the cold start waterfall. They work with the physics rather than against them. Importantly, they stack—combining multiple patterns yields cumulative improvement.
Pattern 1: Keep Replicas Warm
The most direct approach to eliminating cold starts is preventing scale-to-zero entirely.
Setting minReplicas: 1 on an InferenceService or Deployment ensures one pod remains running continuously. When the first request arrives, it routes to the warm pod immediately. The autoscaler provisions additional replicas in the background while the warm pod serves traffic.
This pattern eliminates all application-level cold start components: CUDA initialization, model loading, and weight transfer. The cost is the hourly rate for the GPU instance—approximately $2 for a T4, $8 for an A10G, $32 for an A100. For many workloads, this cost is smaller than the business impact of multi-minute response times.
For LLM workloads, inference engines like vLLM and TensorRT-LLM provide an additional benefit: the KV cache for system prompts stays warm. Requests sharing the same system prompt avoid recomputing attention for prompt tokens, reducing not just cold start but steady-state latency.
Pattern 2: Cache Models Locally
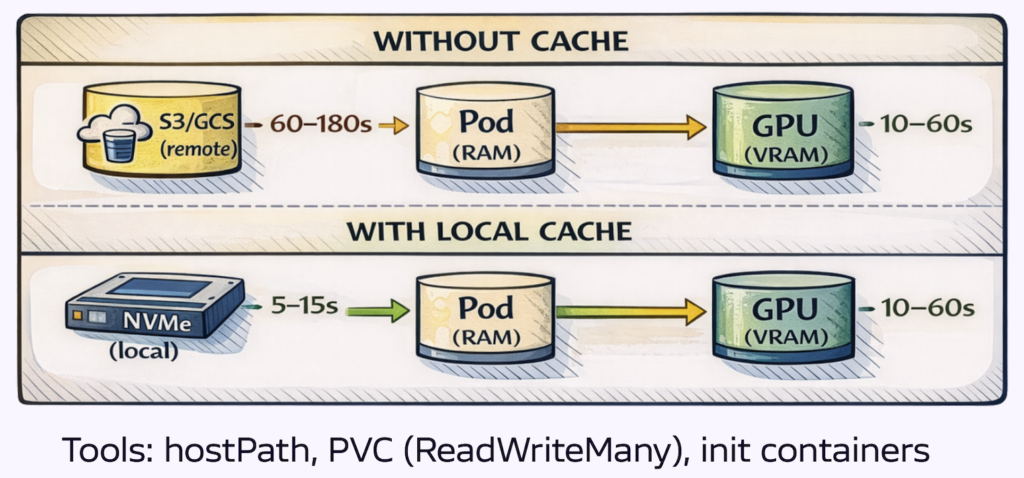
Model download from object storage often represents the largest single component of cold start time—60 to 180 seconds for large models over typical network connections. Caching models on node-local storage reduces this to local disk read time.
hostPath volumes mount a node directory into the pod. The first pod on a node downloads the model and writes it to the hostPath location. Subsequent pods find the model already present. Simple to implement; requires node affinity to ensure pods land on nodes with cached models.
PersistentVolumeClaims with ReadWriteMany provide a shared filesystem across nodes. The model downloads once and becomes accessible to all pods mounting the volume. More complex infrastructure; eliminates node affinity requirements.
Init containers download the model before the main container starts. The main container mounts the same volume and begins with the model present. Useful when model freshness matters, as the init container can check for updates.
KServe’s storage initializer implements this pattern natively. When you define an InferenceService, KServe injects an init container that downloads model weights from the configured storage backend—S3, GCS, Azure Blob, Hugging Face Hub—before the serving container starts. Enable the model cache annotation (serving.kserve.io/enable-model-cache: "true") and KServe writes the downloaded weights to a node-local persistent volume. The next pod scheduled to that node skips the download entirely and reads from local disk. For teams already running KServe, this is the path of least resistance: no init container to write, no volume management to wire up manually.
OCI Image Volumes, introduced in Kubernetes 1.31 and promoted to beta in 1.33, package model weights as OCI artifacts stored in container registries. The container runtime handles caching and versioning through standard image layer mechanisms. This is an idiomatic approach that integrates with existing container workflows.
Lastly, Local NVMe provides 3–7 gigabytes per second read throughput versus variable hundreds of megabytes per second from cloud object storage. The improvement is substantial. The PCIe transfer to GPU memory still occurs, but eliminating network download removes the most variable component of the waterfall.
Pattern 3: Reduce What You Transfer
Three techniques reduce or parallelize the PCIe transfer itself.
Quantization reduces the numerical precision of model weights—essentially compressing the model by storing numbers with fewer bits. Moving from FP16 (2 bytes per parameter) to INT8 (1 byte) halves transfer volume. INT4 (0.5 bytes) quarters it. A 7 billion parameter model drops from 14 GB to 7 GB to 3.5 GB.
The tradeoff is accuracy. Lower precision means some information loss, and the impact varies by model and task. A chatbot might tolerate INT4 with minimal quality degradation, while a medical imaging model might not.
The practical approach is to use pre-quantized checkpoints—model snapshots already converted to lower precision and validated for quality. Model registries like Hugging Face offer these in various formats. Download the pre-quantized version rather than quantizing at runtime, which adds startup overhead and belongs in experimentation, not production
Tensor parallelism distributes model weights across multiple GPUs. Each GPU loads one fraction of the total, and host-to-device transfers occur in parallel. A 4-GPU configuration transfers four streams simultaneously, approaching 4x the effective bandwidth. vLLM supports this via the --tensor-parallel-size flag.
Streaming weight loading pipelines disk reads with GPU transfers. The safetensors format supports memory-mapped access, allowing the operating system to page weights on demand. This means Disk I/O, GPU transfer, and CUDA initialization overlap rather than executing sequentially.
If we combine these techniques: a 70 billion parameter model quantized to INT4 (17.5 GB) with 4-way tensor parallelism loads approximately 4.4 gigabytes per GPU, and becomes transferable in low single-digit seconds depending on interconnect and runtime.
Pattern 4: Keep Nodes Warm
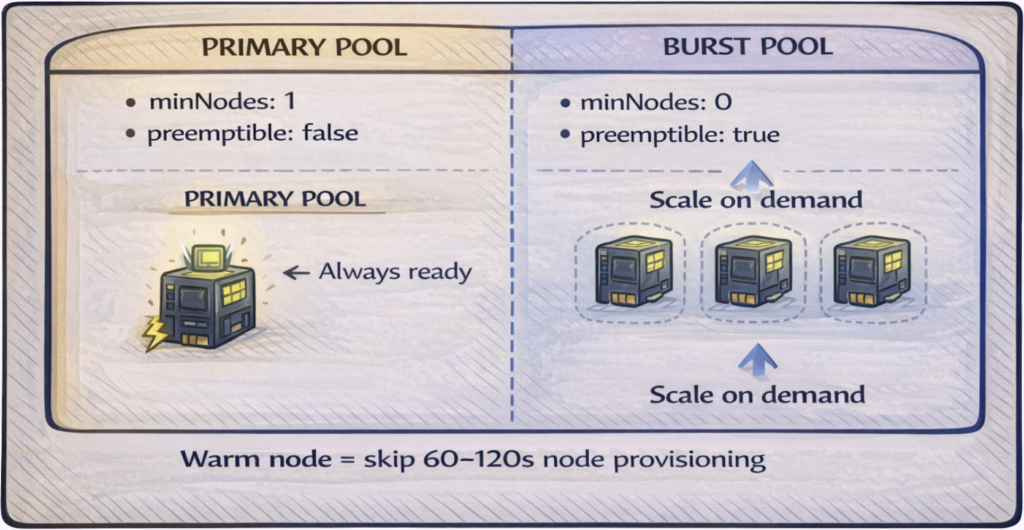
Node provisioning accounts for 60 to 120 seconds of cold start time. The cloud provider must allocate a VM, boot the OS, initialize GPU drivers, and register the kubelet. Maintaining ready GPU nodes eliminates this delay entirely.
The challenge is cost. GPU nodes are expensive to keep idle. The solution is a tiered approach that balances availability against spend.
Primary pool: minNodes: 1, on-demand (non-preemptible) instances. One GPU node remains ready at all times. This is your always-on capacity—warm replicas from Pattern 1 land here immediately. Cost is predictable: one node’s hourly rate, 24/7.
Burst pool: minNodes: 0, spot or preemptible instances. This pool scales from zero when demand exceeds primary capacity. You accept the cold start penalty for overflow traffic in exchange for 60-90% cost savings on burst compute. When spot instances get reclaimed, workloads shift back to primary or wait for replacement nodes.
The two pools serve different purposes: primary guarantees availability for baseline traffic, while the burst pool handles spikes economically. Most production deployments need both.
Additional optimizations:
- Scheduled scaling: If traffic patterns are predictable (e.g., 9 AM spike), provision burst nodes at 7:00 AM. The cold start happens before users arrive.
- Image pre-pulling: Deploy a DaemonSet that pulls your inference container image to all GPU nodes. When a pod schedules, the image is already cached—eliminating 30-60 seconds from the waterfall.
The Operational Divide
The first three patterns are engineering problems with engineering solutions. Configure them once, validate they work, move on. Pattern 4 is different—it’s an operations problem, and operations problems don’t get solved, they get managed.
This is where most optimization efforts stall. Teams implement patterns 1-3, measure improvement, and declare victory. But node pool management requires ongoing attention that competes with every other operational priority. Node pools drift out of sync with actual demand. Scheduled scaling jobs become stale as traffic patterns shift. Pre-pull DaemonSets fall behind as new models deploy. This may cause cold starts to return at precisely the moments they matter most.
The underlying issue is that Pattern 4 requires continuous feedback: what’s the current demand, what capacity exists, what’s the cost of being wrong in either direction? It’s a control loop that needs automation.
Continuous GPU Optimization with ScaleOps
ScaleOps provides that control loop. Four capabilities work together:
Visibility into Actual Usage
ScaleOps monitors GPU utilization—compute and memory—rather than relying on Kubernetes resource requests. The gap between what workloads request and what they consume is typically substantial. Most GPU workloads request a full device but use a fraction of capacity. This gap represents optimization opportunity that remains invisible without utilization telemetry.
Right-Sized Allocations
Based on consumption data, ScaleOps computes right-sized GPU recommendations and applies them through admission and scheduling for automated workloads. When workloads don’t need a full GPU, multiple workloads can share the device—actual sharing semantics depend on the NVIDIA runtime configuration. This leads to more inference workloads running per physical GPU and a reduction in per-request infrastructure cost.
Proactive Capacity Provisioning
When GPU workloads enter the scheduling queue, ScaleOps creates capacity demand early in the scheduling cycle, so node provisioning starts sooner and more predictably. The GPU node begins spinning up while your workload waits for scheduling, rather than after the standard autoscaler detects the gap.
The result is faster scale-out without maintaining excess warm capacity.
Constraint-Aware Placement
ScaleOps respects existing workload constraints: node selectors, tolerations, affinity rules. Capacity provisions where workloads will actually land, not where generic GPU nodes happen to exist. The optimization layer works within deployment-defined boundaries rather than overriding them.
Outcomes
- Faster scale-out: GPU capacity ready when demand arrives, not minutes later
- Higher utilization: Right-sized allocations reduce idle GPU time
- Lower cost: Infrastructure spend follows actual usage, not worst-case provisioning
- No manifest changes: Works with existing deployments and scheduling constraints (GPU automation requires enabling the relevant policies in ScaleOps)
Patterns 1–3 remain your deployment-level decisions: replicas, caching, loading strategies. ScaleOps handles the operational layer underneath, continuously optimizing what would otherwise require manual attention across every cluster.
Where to Start
GPU cold starts in Kubernetes result from sequential operations with physical constraints: PCIe bandwidth limits weight transfer, CUDA initialization requires per-process work, and GPU memory architecture mandates explicit data movement. These constraints don’t disappear with better configuration.
Four patterns address different stages:
- Warm replicas prevent scale-to-zero, eliminating application-level cold start entirely
- Local model caching removes network download, the most variable waterfall component
- Quantization and parallelism reduce and parallelize the PCIe transfer
- Warm node pools eliminate provisioning time for the first pod
The patterns stack. Combining multiple approaches based on cost tolerance, model size, and traffic patterns yields cumulative improvement.
The practical starting point is measurement. Instrument timestamps at each stage: node provisioned, container started, model downloaded, CUDA initialized, first inference served. The data identifies which stage dominates your specific waterfall and where optimization effort will have impact.
Patterns 1–3 are configuration changes you can implement this week. Pattern 4 is ongoing operations—node pool management, scheduled scaling, capacity balancing—that benefits from automation as cluster count grows.
For automated GPU optimization that handles Pattern 4 continuously, explore how ScaleOps reduces cold start time and improves utilization across Kubernetes clusters.
Book a demo → to see GPU optimization in action across your clusters.
Frequently asked questions
Q: What is a GPU cold start in Kubernetes?
A: A GPU cold start is the delay that occurs when a Kubernetes pod must start from scratch after being scaled to zero. It involves a sequence of steps — node provisioning, container image pull, model download, CUDA initialization, and weight transfer to GPU memory — that together can take 3 to 8 minutes before the first inference is served.
Q: What are the stages of a GPU cold start in Kubernetes?
A: A GPU cold start proceeds through five sequential stages: node provisioning (60–120 seconds), container image pull (30–60 seconds), model download (60–180 seconds), CUDA context initialization (5–30 seconds), and weight transfer from system RAM to GPU VRAM (10–60 seconds). Each stage must complete before the next can begin, which is why optimizing only one stage yields limited overall improvement.
Q: Why does CUDA initialization slow down GPU pod startup?
A: CUDA creates a separate context for every process that uses a GPU, regardless of whether another process on the same node has already initialized CUDA. This means that even on a node with a warm GPU, every new pod must go through full CUDA context initialization — allocating GPU memory, loading the driver, and registering kernels — before it can run inference.
Q: Why don’t NVIDIA MPS or MIG solve GPU cold start times?
A: NVIDIA MPS is designed to improve GPU utilization by sharing a CUDA context across processes, and MIG is designed to isolate workloads into separate GPU partitions — neither was built to reduce startup latency. Model weights still need to be loaded into VRAM for each workload regardless of MPS or MIG, so the dominant cold start components remain unchanged.
Q: How does Kubernetes work with GPUs?
A: Kubernetes supports GPUs through device plugins, which expose GPU hardware as schedulable resources that pods can request. When a pod requests a GPU, Kubernetes schedules it onto a node with an available GPU device, but the pod still must complete all initialization steps — including CUDA context setup and model weight loading — before it can process requests.
Q: What is the most effective way to eliminate GPU cold starts in Kubernetes?
A: The most direct approach is to prevent scale-to-zero by setting minReplicas: 1, which keeps at least one pod running at all times. When traffic arrives, it routes immediately to the warm pod while additional replicas scale up in the background, eliminating all application-level cold start components including CUDA initialization and model loading.
Q: Why are GPU cold starts more costly than CPU cold starts in Kubernetes?
A: CPU pod startups typically take seconds, making scale-to-zero a practical cost-saving strategy. GPU pods take 3 to 8 minutes to become ready due to hardware constraints like PCIe bandwidth limits and per-process CUDA context initialization, meaning the GPU consumes billable compute time — at $2 to $32 per hour depending on the instance — while serving zero requests during startup.