Main Takeaway
Kubernetes VPA promises to fix drift automatically, but most teams avoid running it fully automated in production because updates can be disruptive, recommendations lack context, and it breaks HPA/KEDA.
ScaleOps doesn’t recommend resource changes. It autonomously manages rightsizing in production, with constraints built in. Workload-aware policies (stateful, stateless, batch, JVM, etc.), real-time burst reaction, and automatic failure mitigation ensure efficiency without risking stability.
The Cost of Stagnation
Kubernetes has evolved through three eras: survival (get containers running), scale (stretching clusters to thousands of nodes), and now efficiency, doing more with less while AI workloads demand resources one minute and sit idle the next.
The numbers are brutal. Sysdig’s analysis of billions of containers found that 69% of purchased CPU goes unused. In a 1,000-node cluster, this represents tens of millions of dollars in “idle tax.”
Datadog reports that 83% of container spend is tied to underutilized resources, with median CPU utilization around 16%.
Every resources.requests block is a frozen hypothesis – a guess made during initial deployment. By Day 100, entropy has invalidated that guess.
That frozen hypothesis is now technical debt with a monthly invoice.
This isn’t just a cost issue, it’s a reliability risk. Over-provisioning burns through cloud budgets and under-provisioning leads to 3 AM pages when a pod OOMKills during a routine traffic surge.
The Kubernetes community built the Vertical Pod Autoscaler (VPA) to solve this, yet less than 1% of organizations use VPA in production. The tool designed to solve the rightsizing problem is too dangerous to actually use.
VPA’s design yields predictable limitations at scale. Here is the math on why.
If you want to see these limitations in your own cluster, ScaleOps runs in read-only mode out of the box. Two minutes to install, immediate visibility into your efficiency score and savings potential. No automation, no changes. Just clarity on what’s being left on the table.
How VPA Actually Works (A Primer)
To understand why VPA fails in production, we must look at its three core components:
| Component | Responsibility | Limitation |
| Recommender | Calculate optimal resources from historical usage. | Backward-looking only; cannot react to real-time spikes. |
| Updater | Evict pods when recommendations diverge significantly. | Binary eviction; causes disruptive restarts. |
| Admission Controller | Apply recommendations at pod creation. | Cannot modify running pods. |
The Three Components of VPA
VPA is a system of three cooperating components, each with a distinct responsibility:
The recommender (VPA’s brain):
- Watches container resource usage via the Metrics Server.
- Maintains decaying histograms of historical consumption.
- Calculates recommended CPU and memory values.
- Stores recommendations in the VPA object’s .status.recommendation field.
- Runs continuously, updating recommendations every few minutes using a sliding historical window.
- Samples one memory peak per day rather than full time-series data
- Applies exponential decay weighting, with yesterday’s data weighted at ~50% of today’s
The recommender is entirely backward-looking. No awareness of live pressure, future demand, or workload context
The Updater (VPA’s enforcer)
- Monitors running pods and compares their current requests to the Recommender’s suggestions
- Determines whether a pod is “out of policy” based on configurable thresholds
- Decision model is binary: either evict the pod or do nothing
- Marks pods as “out of policy” and evicts them when necessary, respecting PodDisruptionBudgets if configured.
- Relies on the Admission Controller to apply correct resources to replacement pods.
The updater has no understanding of workload criticality, latency sensitivity, or failure domains
The Admission Controller (VPA’s last mile)
- Implemented as a mutating webhook.
- Intercepts pod creation requests and overwrites resource requests with the Recommender’s current values.
- Historically required pod recreation because it could only modify pods at creation time.
- With Kubernetes v1.35, In-Place Pod Resize is GA, and VPA’s InPlaceOrRecreate mode can now attempt live updates.
But the Recommender feeding those updates hasn’t changed. And that’s where the real problems live.
VPA’s Modes of Operation
VPA’s modes tell a story of escalating risk: from safe but passive, to automated but fragile, to actively disruptive. Each step trades operational safety for automation.
Off Mode (Visibility only)
- VPA calculates resource recommendations and writes them to the VPA object’s status field
- No pods are modified and no actions are taken
What this really means: You get insight without risk. VPA acts as a sizing calculator, not an automation system. This is useful for initial baselines, but it does nothing to prevent long-term resource drift.
Most teams stay here.
Initial Mode (Day-1 Automation)
- VPA calculates and applies recommendations only when pods are first created
- Running pods are never updated afterward
What this really means: Day-1 sizing is automated but by Day-100 reality is ignored. Workloads drift and VPA observes, but never intervenes.
This mode automates the initial guess, not ongoing correctness.
Recreate Mode (Disruptive Automation)
- The Updater compares running pods to current recommendations
- If the deviation exceeds a threshold, the pod is evicted
- The Admission Controller applies new values when the replacement pod starts
What this really means: VPA enforcement means restarting pods.
And in practice, eviction causes real damage:
- JVM loses its JIT-compiled code
- Redis cache goes cold
- PostgreSQL connections reset.
InPlaceOrRecreate Mode (The forward-looking option)
- Kubernetes 1.35 graduated InPlacePodVerticalScaling to GA (Dec 2025) and VPA 1.5.0 promoted this mode to Beta
- VPA attempts to modify pod resources in-place by adjusting cgroups without restarting the container
- If in-place fails, VPA falls back to eviction.
This sounds like the fix everyone was waiting for. It isn’t.
VPA’s InPlaceOrRecreate is a “try-and-fail” approach. It attempts in-place resize without checking feasibility first.
In-place fails if:
- The node lacks capacity
- The resize would change the pod’s QoS class
- The container’s resizePolicy requires a restart
And then VPA falls back to eviction anyways. The “OrRecreate” in the name says it all: the fallback is baked into the design.
The delivery mechanism is finally production-ready. The recommendation engine remains unchanged. And the update strategy still doesn’t check before it acts.
The “DIY” Trap: Why Manual Tuning & Recommendations Fail
If VPA’s automation is too risky for production, what about using it as a recommendation engine and applying changes manually?
This is the path most teams take. It doesn’t work either.
The Goldilocks Mirage
Tools like Goldilocks are excellent for initial discovery. They deploy VPA in recommendation mode, surface sizing suggestions through a dashboard, and generate YAML that humans can review. For a one-off audit or initial cluster setup, this is genuinely useful.
The problem is what happens after Day 1.
Goldilocks gives you a static snapshot derived from historical data. By the time you open the PR to update the YAML, traffic patterns have shifted. A new feature deployed. A dependency upgraded. You’re replacing one frozen hypothesis with a slightly newer frozen hypothesis. The fundamental problem remains unsolved.
In large fleets, this model becomes a treadmill. Dozens or hundreds of PRs per week, each requiring manual review, approval, merge, and rollout. Goldilocks is a read-only tool. It generates a perpetual to-do list of sizing recommendations that an engineer must manually apply via kubectl patch or a GitOps workflow. The operational load stays the same. You’ve just moved it from “guess at deploy time” to “review PRs weekly.”
And when HPA is managing the same workload, Goldilocks recommendations become actively misleading. The tool sees VPA’s output without understanding that HPA is controlling replicas. During scale-out, each pod uses less CPU. VPA interprets this as “pods are over-provisioned” and recommends lower requests. Apply those recommendations, and when HPA scales back down, your pods are undersized for the concentrated load.
The Tuning Fallacy
The next instinct is to tune VPA itself. Adjust the flags. Shorten the aggregation window. Change the percentile targets.
You can’t tune your way out of architectural constraints.
VPA exposes a handful of global knobs: target-cpu-percentile, target-memory-percentile, recommendation-margin-fraction. But they apply to every workload in your cluster. The same histogram logic serves your latency-sensitive API gateway and your nightly batch ETL. The same decay model applies to your stateful database and your stateless worker fleet.
These workloads have nothing in common. They need different strategies. VPA gives them identical treatment.
The tuning trade-offs are lose-lose. Shorten the aggregation window and recommendations become jittery, triggering restart loops on minor usage fluctuations. Lengthen it and you smooth out the spikes that actually matter. Your P90 load becomes invisible to the recommender.
You cannot tune a global algorithm to fit workloads with fundamentally different needs. A stateful database needs stability and conservative updates. A stateless worker needs agility and fast reaction. VPA forces you to pick one profile and accept the consequences for everything else.
When to Use What
Before we dive into VPA’s deeper architectural failures, here’s when each approach actually makes sense:
| Scenario | Tool | Why |
| Single-cluster dev/staging | VPA in Off mode | Low risk. Use recommendations for initial sizing. |
| Periodic audits – no automation | Goldilocks | Generates PRs with VPA-backed recommendations. Good for visibility. |
| Memory-only sizing (CPU managed by HPA) | VPA in Initial or Recreate | Avoids HPA conflict if you tolerate occasional evictions. |
| Production fleets at scale | ScaleOps | Continuous adjustment, workload-aware policies, real-time reaction. |
| Migrating from VPA | ScaleOps (Read-only) → ScaleOps (Automated) | See your savings potential first. Enable automation with one click. |
The Architecture of Failure: Deconstructing VPA
The Disruption Tax
When VPA decides a pod needs different resources, it evicts the pod. The replacement starts with the new values. In a test cluster, this is fine. In production, eviction triggers a cascade of secondary failures.
Your JVM loses its JIT-compiled code and restarts cold. Your Redis instance drops its in-memory cache, triggering a miss storm against your database. Your PostgreSQL connection pools reset, causing transient errors across dependent services. Your user’s WebSocket session disconnects mid-transaction.
This is why the Datadog report found less than 1% VPA adoption in production. The tool designed to optimize resources became a source of outages.
InPlaceOrRecreate mode fixes the delivery mechanism. Pods can now receive new resource values without restarting. But if VPA recommends the wrong value, it still applies the wrong value. You’ve eliminated the restart tax while keeping the bad recommendation. That’s progress on one axis, regression risk on another.
But “without restarting” deserves scrutiny. VPA doesn’t check feasibility before attempting the resize. It tries, and if it fails, it falls back to eviction. The “OrRecreate” in the name tells you everything. Here’s what can go wrong:
- Node lacks capacity: Resize fails. Eviction anyway.
- QoS class would change: Kubernetes rejects it. Eviction anyway.
- Container’s resizePolicy requires restart: You configured for in-place, but the policy forces a restart anyway.
- Memory decrease below current usage: Resize enters limbo. Spec says 2GB, cgroup stays at 4GB, pod runs in purgatory until someone notices PodResizeInProgress buried in status.
- Application doesn’t hot-reload: JVM’s -Xmx was set at startup. Node.js max-old-space-size doesn’t change. PostgreSQL shared_buffers won’t expand. The cgroup changed. The process didn’t notice.
- Sidecars ignored: VPA rightsizes your main container. Your Istio proxy (different resource patterns, possibly no metrics) stays at original sizing.
- Single replica with strict PDB: VPA can’t evict, and if in-place resize fails for any reason, the pod sits with wrong resources indefinitely. No alert, no action. Just waiting for the next loop that never fixes anything.
The delivery mechanism is production-ready, but the failure modes haven’t really changed – unless your rightsizing solution checks node capacity before recommending, understands that JVMs need heap tuning not just cgroup changes, and knows which workloads can tolerate in-place updates versus which need zero-downtime pod replacement. I’ll let you guess who does that with zero configuration.
The One-Size-Fits-All Problem
Consider two workloads in the same cluster: a PostgreSQL database serving your production API, and a nightly batch job that processes yesterday’s logs.
The database needs conservative sizing. It should never be undersized, tolerates being slightly over-provisioned, and absolutely cannot tolerate mid-day evictions. You’d configure it at P98 with a 15% safety buffer and a maintenance window at 3 AM.
The batch job has different requirements entirely. It runs for 20 minutes, spikes hard, then disappears. It needs aggressive optimization (P85 would be fine), but it absolutely cannot be interrupted mid-execution. Kill it halfway through, and you’ve wasted the compute and have to start over.
VPA gives them both the same P90. Same 8-day histogram. Same 24-hour decay. Same update logic. And more importantly: VPA has no concept of “wait for this job to finish”. It sees a pod, decides it needs different resources, and evicts. Mid-execution? VPA doesn’t know. Doesn’t care.
The flags that control this behavior are global to the Recommender binary. Change them for your database, and you’ve changed them for your batch job. There’s no per-workload configuration in the VPA CRD for algorithm behavior. You get modes and min/max bounds. You don’t get per-workload percentile targets. You don’t get job lifecycle awareness.
The workaround works: run multiple VPA Recommender instances with different flags, sharded by namespace. But now you’re operating multiple control planes for what should be a single policy decision. And you still don’t have job completion awareness.
The Historian Problem
At its core, VPA is a historian, not a first responder.
The Recommender maintains decayed histograms over an eight-day window with a 24-hour half-life. Yesterday’s data carries half the weight of today’s. Data from four days ago carries 6.25% weight. This exponential decay means VPA is mathematically incapable of reacting to what’s happening right now.
When a traffic spike hits, VPA doesn’t see it as an emergency. It sees it as one data point in a week-long histogram. By the time the spike accumulates enough weight to shift the recommendation, your pods have been throttling for hours or days.
VPA is driving by looking in the rearview mirror. The recommender flags tell you this explicitly: cpu-histogram-decay-half-life, memory-histogram-decay-half-life, recommender-interval. Every parameter is about how to weight the past, not how to detect the present.
The Ratio Preservation Trap
Here’s where VPA can actively make performance worse.
By default, VPA updates both requests and limits to preserve your original ratio. Your pod had 100m request and 400m limit, a 4:1 ratio. VPA sees low average usage and recommends 60m. The limit drops to 240m. Same ratio. 40% less burst ceiling. When the next traffic spike arrives, your pod throttles, even though the node has available CPU. The scheduler didn’t starve you. VPA did.
There’s no alert. Nothing highlights that your safety margin evaporated. You find out when latency spikes.
VPA offers controlledValues: RequestsOnly as a workaround, leave limits alone. But now you’re managing limits manually, and VPA still recommends tiny requests based on P90 averages. The scheduler bin-packs your pods tighter. Instead of hitting a limit, your app fights neighbors for CPU. Same throttling, different cause.
This is why enabling VPA can cause more throttling, not less.
That’s the architecture. Now let’s see what happens when these design decisions meet production workloads that don’t behave like steady-state averages.
Case Study: The TaxiMetrics Meltdown
TaxiMetrics is a ride-sharing analytics platform with ML-powered fare predictions. The application stack is the following:
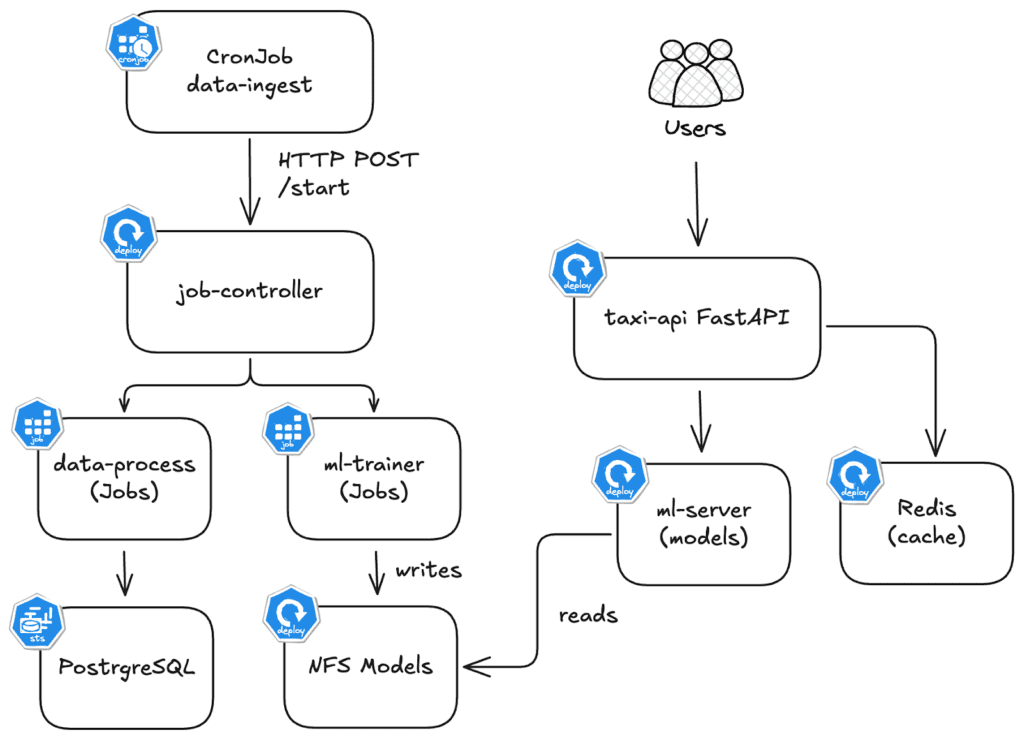
| Component | Type | Resource Pattern |
taxi-api | Deployment (HPA 2-10) | Bursty. Serves prediction endpoints. 10x spikes during surge pricing. |
ml-trainer | Job (on-demand) | Batch. Needs 2 CPU and 4GB for 5 minutes, then terminates. |
ml-server | Deployment (1 replica) | Steady. Loads trained models from PVC. Low baseline. |
postgresql | StatefulSet (1 replica) | Steady. 3.3M+ taxi records. Needs stability over optimization. |
The application has two main flows:
Inference Flow (Real Time)
- User POSTs trip details to predict tip
- taxi-api validates & checks redis cache
- ml-server loads model from NFS
- Returns prediction (e.g. “$4.50 tip”)
Batch Flow (every 10 min)
- CronJob triggers job-controller
- data-processor loads 3.3M taxi trips
- Writes to PostgreSQL
- ml-trainer trains & saves models to NFS
Each component needs a different sizing strategy.
taxi-apineeds burst headroom.ml-trainerneeds massive resources briefly, then nothing.ml-serverneeds stability.postgresqlneeds predictability.
VPA applies the same algorithm to all four.
Failure Mode 1: The Throttling Cascade (taxi-api)
Example of taxi-api throttling cascade:
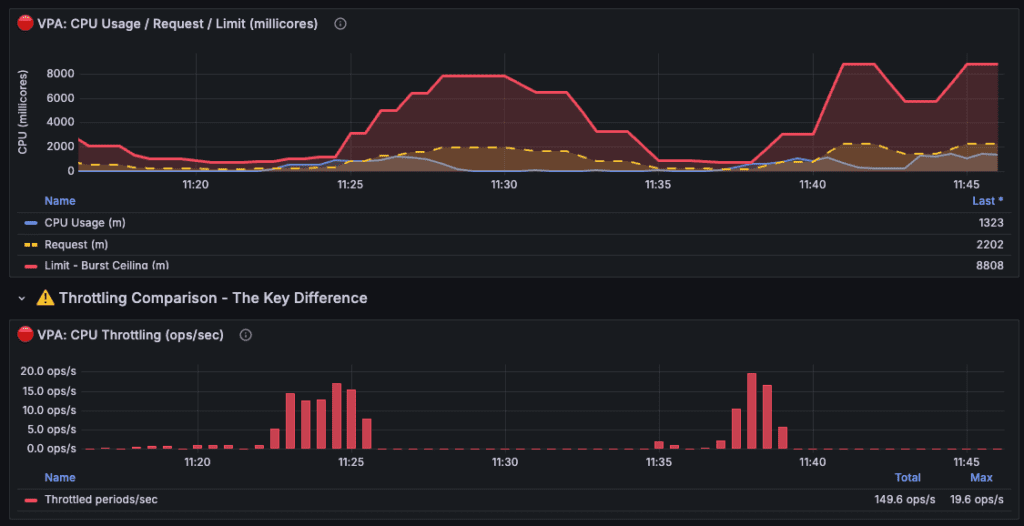
Notes:
- Values shown are the sum across all taxi-api pods (2 replicas). Divide by 2 for per-pod values. VPA settings were accelerated for demo purposes.
- The histogram half-life was reduced from 24 hours → 2 minutes (720× faster). 1 minute on the graph ≈ 12 hours in production.
| Time | Event | Total Limit | What Happened |
| ~11:20 | Baseline | 2000m | VPA observing usage, starting to lower |
| ~11:23-11:26 | Throttle #1 | 1500m | Spike hit lowered ceiling → 19.6 ops/s throttling |
| ~11:26-11:30 | Recovery | 7000m | VPA reacted, increased resources |
| ~11:30-11:35 | Idle decay | 4000m | VPA sees low usage, lowers again |
| ~11:35-11:37 | Throttle #2 | 2500m | Another spike, ceiling too low again |
| ~11:38-11:41 | Throttle #3 | 3000m | Third spike, VPA still catching up |
| ~11:45 | Stabilized | 8800m | VPA finally learned, set high buffer |
Friday, 5 PM. Rush hour hits after 22 hours of low utilization.
taxi-api originally had 200m request and 800m limit, a 4:1 ratio. VPA watched, calculated, and recommended: drop the request from 200m to 120m. The limit followed proportionally, 800m down to 480m. Same 4:1 ratio. 40% less burst ceiling. No alert. No indication that safety margin had evaporated.
When Friday traffic spiked, the pods had CPU available on the node. The problem was the 480m limit VPA had silently imposed. The pods hit their ceiling and throttled. container_cpu_cfs_throttled_seconds_total climbed while the node sat with headroom to spare. Latency spiked. Users complained.
The ratio preservation behavior removed burst headroom exactly when it was needed. VPA optimized for yesterday’s average while destroying today’s peak capacity. And if HPA is watching? It sees high CPU utilization, scales out, and now you have 6 pods throttling instead of 3. The cloud bill increases while the problem persists.
Failure Mode 2: The Batch Job Blind Spot (ml-trainer)
ml-trainer is a Kubernetes Job. It retrains 5 ML models, needs 2 CPU and 4GB for about 5 minutes, then terminates. And here’s where VPA’s architecture hits a wall.
VPA can technically provide recommendations for Jobs. But its eviction model doesn’t understand batch semantics. A Job should run to completion – that’s the whole point. VPA’s Updater doesn’t know that. It sees a pod, decides resources should change, and evicts. Minute 3 of a 5-minute training run? It Doesn’t matter, the job restarts from zero. The compute is wasted and the training is delayed.
So you run VPA in Off mode for Jobs, which means no automation at all. Or you leave it on and accept that your batch workloads might get killed mid-execution whenever recommendations shift.
That’s an architectural boundary that shows up the moment you have workloads that aren’t “run forever.”
Failure Mode 3: The Release Loop (ml-server)
The ML team ships v2 with two additional models, bumping memory requirements from 256MB to 512MB. The deployment passes staging and rolls out Tuesday morning. By afternoon, pages start firing, and the pod keeps OOMKilling on startup.
VPA is still recommending 285MB because its histogram doesn’t reset on deployments. It has no concept of “new version.” What it sees is eight days of v1 running comfortably at 240MB, weighted by a 24-hour half-life that makes yesterday’s samples worth 50% and last week’s worth almost nothing. The handful of samples v2 generated before crashing can’t outweigh that history.
So you wait.
- Day one, the recommendation climbs to ~320MB – still crashing.
- Day two hits ~400MB, and crashes become less frequent.
- By day four, VPA finally recommends enough memory to run v2 stable. Four days of production instability because the algorithm needed time to unlearn the version you replaced.
That’s what happens when your rightsizing tool doesn’t understand what it’s scaling. VPA applied the same algorithm to a bursty API, a batch job, and a version upgrade – and failed differently each time. Same algorithm, different failures. ScaleOps starts from a different assumption: workloads aren’t identical, so their optimization shouldn’t be either.
The ScaleOps Approach: Context-Aware Rightsizing
Where VPA offers one algorithm and hopes it fits, ScaleOps matches the optimization strategy to the workload. Auto-detected. Continuously managed. Node-aware.
Safety-First Automation
Most teams disable VPA’s Auto Mode because they can’t control when or how updates happen. ScaleOps inverts this.
Application detection drives update strategy: PostgreSQL, MongoDB, Kafka, Redis, and Java apps are identified automatically. Databases get conservative updates that respect connection handling. Java workloads get JVM-aware restarts that account for heap warmup. Stateless services get more aggressive optimization.
Workload detection adds another layer: Jobs and CronJobs are never evicted mid-execution. ScaleOps waits for natural completion, then right-sizes the next instance. StatefulSets get ordinal-aware updates. Deployments with HPA get production-safe policies that won’t conflict with horizontal scaling.
No labels, no annotations. Detection happens automatically as workloads are deployed.
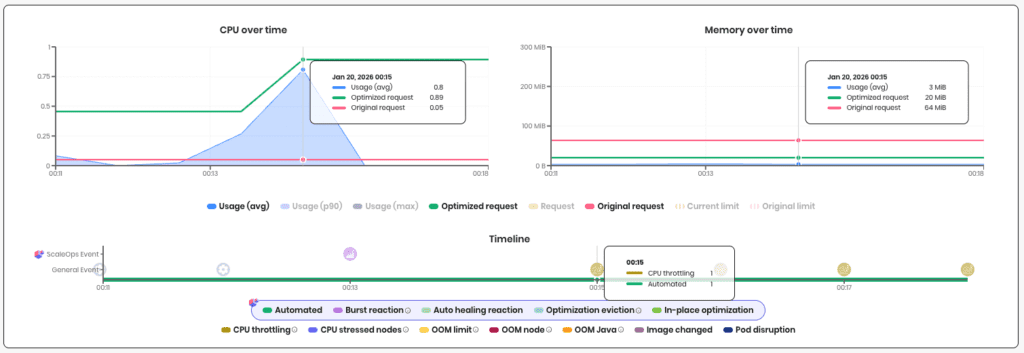
Real-Time Burst Reaction
ScaleOps monitors real-time resource usage against historical baselines. When usage shows a sustained increase beyond normal patterns, Burst Reaction kicks in rather than waiting for histograms to catch up. Optimizations shift to higher percentiles, giving your workload headroom until normal patterns resume..
Auto-healing handles memory the same way. When a pod gets OOMKilled, ScaleOps immediately bumps the memory request with the new allocation. No waiting for the next recommender pass. The failure happened, the fix ships.
Burts Reaction in action, catching a spike early:
Policy Granularity
ScaleOps doesn’t apply a single algorithm to every workload. Policies can vary by workload, by namespace, or across the entire cluster.
At the workload level: different percentile targets for bursty APIs versus steady-state services. Different observation windows for batch jobs versus long-running processes. Different limit strategies for memory-sensitive workloads versus CPU-bound compute.
At the namespace level: production namespaces get conservative headroom margins. Development namespaces get aggressive optimization. Cost-sensitive teams can tune differently than reliability-focused teams.
For most users, the defaults handle this automatically. But when teams need control, every parameter is exposed. No black boxes.
Node Context Intelligence
VPA operates in a vacuum. It sees pod metrics and calculates recommendations with no awareness of the node underneath. A liveness probe fails because the node is CPU-starved? An OOM happens because a noisy neighbor exhausted memory? A recommendation exceeds what any node can schedule? VPA can’t tell the difference – it just sees symptoms and guesses at fixes.
ScaleOps connects pod behavior to node conditions. When liveness probes fail, it checks whether the node is stressed and whether the container is hitting limits – if neither, it concludes “not a resource issue” and doesn’t blindly bump requests. When OOMs occur, it distinguishes node-level kills from container limit breaches, so you know whether to fix the pod or investigate the node.
Recommendations are capped at what your nodes can actually schedule. Fewer false positives. Faster root cause. No pods stuck Pending on impossible requests.
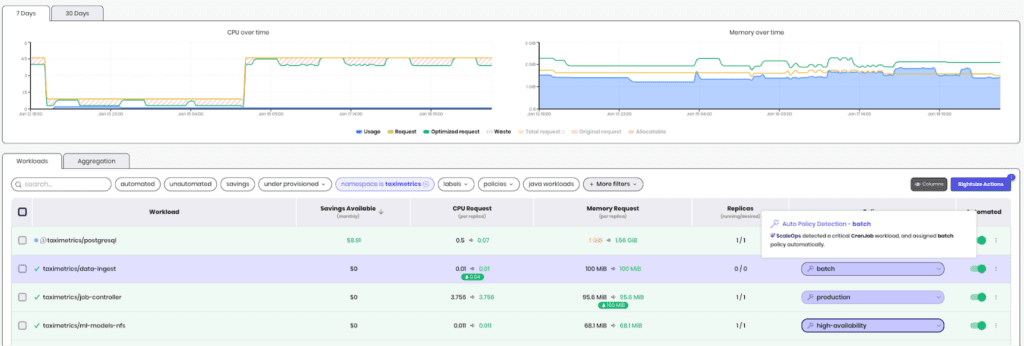
The Recovery: TaxiMetrics with ScaleOps
ScaleOps enabled on the taximetrics namespace. No policy configuration. No tuning. Single Helm install.
What ScaleOps detected:
| Component | Detection | Policy Assigned |
| taxi-api | Deployment + HPA | production |
| ml-server | Deployment | production |
| ml-trainer | Job | batch |
| postgresql | StatefulSet + PostgreSQL | high-availability |
No labels, no annotations. The detection happened automatically as workloads were already running.
Failure Mode 1 → Fixed: When Friday traffic spiked on taxi-api, Burst Reaction detected the sustained increase and overrode the percentile calculation to capture the spike. Because ScaleOps preserves original limits by default, the burst ceiling stays intact. Zero throttling.
Failure Mode 2 → Fixed: ml-trainer was detected as a Job and assigned the batch policy. When it ran, ScaleOps observed the actual training profile, not 23 hours of zeros. No mid-execution eviction. The next job instance got right-sized resources based on real execution data.
Failure Mode 3 → Fixed: When ml-server v2 OOMKilled on first deploy, auto-healing bumped memory immediately. One restart, not four days of loops. The decay model still exists, but failure signals get priority.
The Results (7-Day Comparison):
| Metric | Before | After | Delta |
| Avg CPU Utilization | 35% | 71% | +103% |
| P95 Latency (taxi-api) | 420ms | 180ms | -57% |
| Throttling Incidents | 12/day | 0 | -100% |
| OOMKills (weekly) | 8-12 | 0 | -100% |
| Node Hours (weekly) | 1,680 | 672 | -60% |
| Est. Monthly Spend | $43k | $17k | -$26k |
Rightsizing drove bin packing. Bin packing drove node consolidation. Node consolidation drove savings. The 33% reduction in node hours came from workloads fitting better on fewer nodes, not from running anything slower.
The Bottom Line
We showed you three failure modes. A bursty API throttled because ratio preservation ate its burst headroom. A batch job evicted mid-execution because VPA has no concept of job lifecycle. A version upgrade that triggered four days of OOMKill loops because decay math can’t adapt to change.
Same recommender. Same histogram logic. Same global percentile. And three different ways to break production.
VPA isn’t broken – it does exactly what it was designed to do. It calculates percentile-based recommendations from historical usage and applies them. The problem is that production workloads need more than a histogram calculator. They need context.
We demonstrated that ScaleOps adds:
- Workload awareness that auto-detects batch jobs, stateful workloads, and stateless services then automatically applies the right optimization strategy for each
- Burst Reaction that overrides percentile calculations when sustained spikes happen, instead of waiting for histograms to catch up
- Auto-healing that responds to failures immediately and surfaces root cause – node pressure vs. container limits vs. noisy neighbors
- Node context that caps recommendations at what your cluster can actually schedule
Rightsizing is stage one. Get it right and you unlock the rest: HPA scales on accurate signals instead of noise. Bin packing improves because workloads are sized to fit. Nodes consolidate because the scheduler has room to work with. The savings compound.
The TaxiMetrics recovery wasn’t magic. It was the same four workloads, same cluster, same traffic patterns. The difference was a rightsizing layer that understands what it’s optimizing.
Kubernetes gave you the syscalls. Now you need the userspace.
Your next step: stop guessing.
- Book a demo to see how ScaleOps handles your specific workloads – bursty APIs, batch jobs, and all your applications.
- Start your free trial and get optimization opportunities in under 5 minutes. No code changes. No manifest rewrites.
Frequently asked questions
What is Kubernetes VPA and why don’t teams use it in production?
Kubernetes Vertical Pod Autoscaler (VPA) automatically calculates and applies resource recommendations for pods, but less than 1% of organizations run it in production because it evicts pods to apply changes, causing service disruptions, and uses a one-size-fits-all algorithm that can’t distinguish between different workload types like databases versus batch jobs.
How does VPA’s recommendation engine actually work?
VPA’s recommender maintains decaying histograms over an eight-day window with a 24-hour half-life, meaning yesterday’s data carries 50% weight and four-day-old data carries just 6.25% weight, making it fundamentally backward-looking and unable to react to real-time traffic spikes or sudden workload changes.
Why does enabling VPA sometimes cause more CPU throttling instead of less?
VPA preserves your original request-to-limit ratio by default, so when it lowers a pod’s CPU request from 200m to 120m, it also drops the limit from 800m to 480m, reducing burst ceiling by 40% exactly when traffic spikes arrive, causing throttling even when the node has available CPU.
What happens when VPA manages a Kubernetes Job or CronJob?
VPA’s updater doesn’t understand batch semantics and will evict a Job mid-execution if recommendations change, wasting the compute already spent and forcing the job to restart from zero, teams either disable VPA for Jobs entirely or accept that batch workloads get killed randomly.
How does ScaleOps differ from VPA’s approach to rightsizing?
ScaleOps auto-detects workload types (databases, batch jobs, stateless services, JVMs) and manages context-specific optimization policies instead of one global algorithm, waits for Jobs to complete before rightsizing, and uses Burst Reaction to override percentile calculations during sustained traffic spikes rather than waiting days for histograms to catch up.
What is ScaleOps Burst Reaction and how does it prevent throttling?
Burst Reaction monitors real-time resource usage against historical baselines and immediately shifts optimizations to higher percentiles when sustained increases occur, giving workloads headroom during traffic spikes instead of waiting for VPA’s eight-day histogram to accumulate enough weight to change recommendations.
Why can’t you tune VPA to work for different workload types?
VPA’s tuning flags like target-cpu-percentile and recommendation-margin-fraction apply globally to every workload in your cluster, forcing you to choose between conservative settings that waste resources on stateless apps or aggressive settings that destabilize databases, there’s no per-workload configuration in the VPA CRD.