Efficient resource utilization is crucial for the optimal performance of any Kubernetes cluster. However, there are several subtle issues that can lead to significant resource wastage, impacting the overall allocatable capacity of the cluster. Understanding these issues is key to maintaining a healthy and cost-effective environment. Below, we discuss some common scenarios where resource wastage occurs.
Pods Stuck on an Image Pull Back Off Error
One of the common culprits of resource wastage is pods stuck in an image pull-backoff error. This occurs when the container image specified for a pod cannot be pulled from the container registry due to reasons like incorrect image name, missing image tags, or registry authentication issues. These pods continuously request CPU and memory resources, even though they are not running any workloads. This reduces the overall allocatable capacity of the cluster, as resources are reserved for these failing pods.
Solution: Regularly monitor and audit your pod creation logs to catch image pull errors early. Implement image pull policies and use image tags correctly. Ensure that your container registry credentials are up to date and accessible.
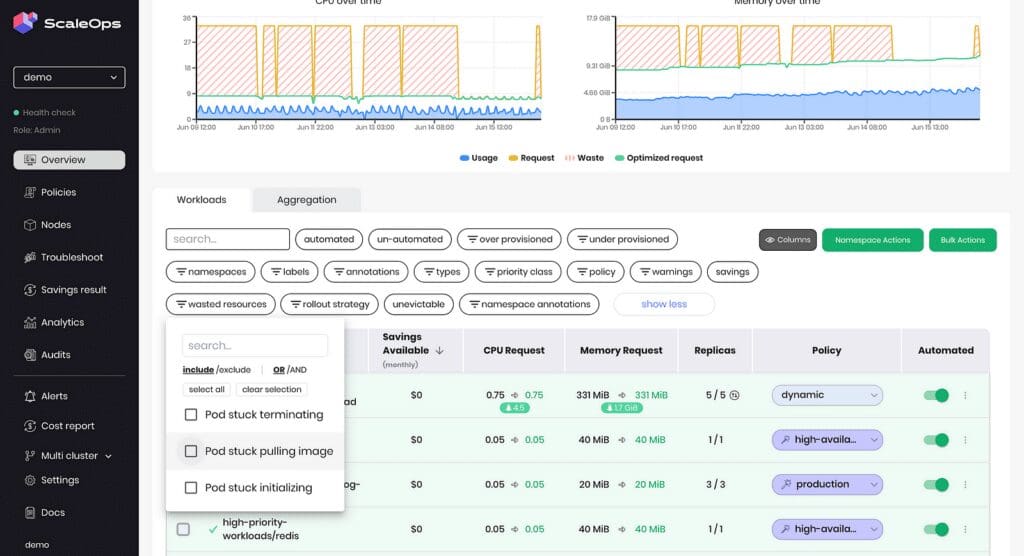
Quickly identify wasted resources using the ScaleOps platform.
Pods in a CrashLoopBackOff State
Another significant resource drain is pods stuck in a CrashLoopBackOff state. This occurs when a pod repeatedly fails and restarts due to misconfigurations, application errors, or missing dependencies. While these pods are restarting, they continue to consume CPU and memory resources, preventing these resources from being allocated to healthy pods.
Solution: Monitor pod logs and events to identify and fix the root cause of the crashes. Implement readiness and liveness probes to ensure your applications are healthy before they start serving traffic. Use logging and monitoring tools to quickly detect and resolve issues causing the crashes.
Pods with Unoptimized Injected Sidecars
Injected sidecars, such as those used in service meshes or logging agents, can also be a source of resource wastage if not properly optimized. These sidecars consume additional CPU and memory resources, and if they are not configured correctly, they can use more resources than necessary. This affects not only the individual pod’s performance but also the overall resource availability in the cluster.
Solution: Carefully review the resource requests and limits for injected sidecars. Optimize their configuration to ensure they are not over-consuming resources. Regularly update and maintain sidecar configurations to keep them in line with the main application’s resource usage patterns.
Pods with Unoptimized Init Containers
Init containers run before the main application containers in a pod start. If these init containers are not optimized, they can lead to unnecessary resource consumption and allocation. The Kubernetes Scheduler will schedule the Pod according to the maximum requested resources among all containers, including init containers.
Unoptimized init containers may be reducing the efficiency of resource usage in the cluster.
Solution: Optimize your init containers by ensuring they perform only necessary tasks and do so efficiently. Limit the resources requested by init containers to only what is required for their operation. Monitor the performance of init containers and make adjustments as needed.
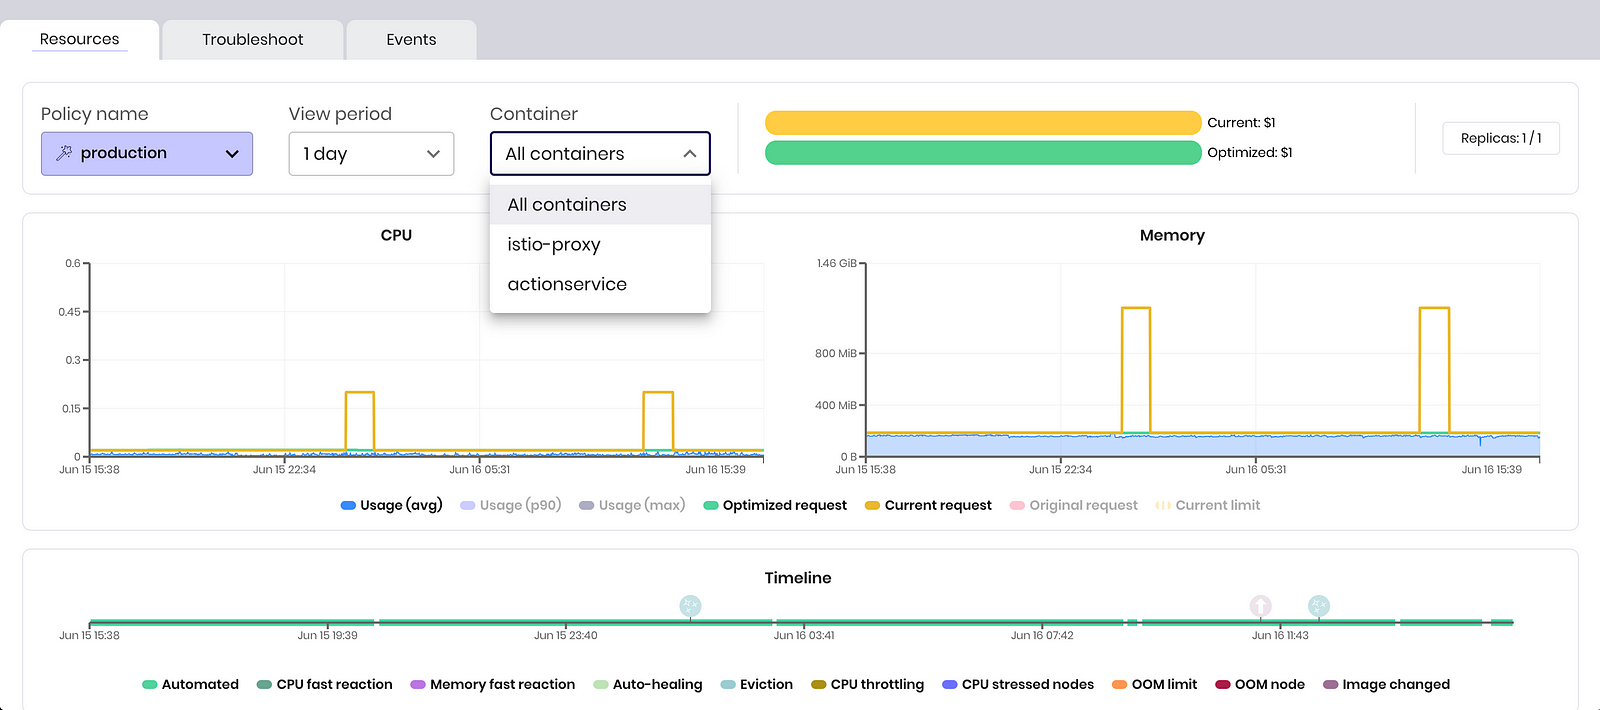
Inspect multiple containers using ScaleOps workload overview
Uninitialized nodes
In a Kubernetes cluster, a node stuck in an uninitialized state can waste resources because it cannot schedule or run any pods, yet it continues to consume underlying infrastructure resources such as CPU, memory, and storage. These resources remain allocated to the uninitialized node, reducing the overall efficiency and capacity of the cluster.
Solution: Regularly monitor the state of nodes across all clusters and take corrective action to terminate and delete.

Using the ScaleOps platform to identify nodes that can not be scaled down
Conclusion
Identifying and addressing these subtle issues can significantly improve the resource efficiency of your Kubernetes cluster. Regular monitoring, optimization, and proactive management of your pods and containers are essential to prevent resource wastage.
By leveraging ScaleOps, you can gain deeper insights about your resource usage across all your clusters and fully automate Pod resource requests to ensure your cluster resources are used efficiently. Try ScaleOps today and transform the way you manage your Kubernetes resources. Visit ScaleOps to get started.
