Kubernetes requests and limits at a glance
- Requests guide pod scheduling; limits control runtime enforcement. Inflated requests waste schedulable capacity and can trigger unnecessary node scale-out.
- CPU limits can throttle latency-sensitive services, even when nodes have spare CPU.
- Memory limits behave differently. When usage exceeds the limit, Kubernetes may terminate the container.
- ScaleOps Automated Pod Rightsizing keeps requests and limits aligned with real workload behavior.
What Are Kubernetes Requests and Limits?
Kubernetes requests and limits are the resource blueprints for your containers. They look like simple YAML fields, but they shape scheduling, runtime behavior, autoscaling, and cloud cost:
- Requests declare the CPU and memory Kubernetes reserves when scheduling a pod. Under node contention, the request is the amount the container is guaranteed. When the node has spare capacity, the container can use more, up to its limit.
- Limits establish the absolute maximum a container is permitted to consume at runtime.
When the scheduler places a pod, it compares the pod’s requests against each node’s allocatable capacity, and ignores real-time usage. Limits play no part in placement. Kubernetes enforces them only after the pod is scheduled.
So getting requests and limits right means treating scheduling and runtime enforcement as two separate decisions.
In the example below, Kubernetes reserves 300 millicores of CPU and 512 MiB of memory for each pod during scheduling. The memory limit also caps the container at 512 MiB at runtime. This example intentionally omits a CPU limit because many latency-sensitive services are better served by a realistic CPU request than a hard CPU cap:
apiVersion: apps/v1
kind: Deployment
metadata:
  name: checkout-api
spec:
  replicas: 3
  template:
    spec:
      containers:
      - name: checkout-api
        image: example.com/checkout-api:1.0.0
        resources:
          requests:
            cpu: "300m"
            memory: "512Mi"
          limits:
            memory: "512Mi"
Get the number wrong in either direction and it costs you. Requests set too high waste schedulable capacity and force the cluster to add nodes it does not need. Requests set too low leave the pod short under load, which drives instability and noisy-neighbor problems.
ScaleOps pro tip
Incorrectly set limits can cause CPU throttling, OOM kills, or misleading safety signals. Use ScaleOps Automated Pod Rightsizing to compare requested resources against actual workload behavior instead of relying on static YAML values.
How Kubernetes Resource Requests Affect Scheduling
Set requests too high and pods sit pending while nodes look half-empty. That happens because requests, not actual usage, decide whether Kubernetes can place a pod on a node. If a pod requests 1 CPU and 2 GiB of memory, Kubernetes reserves that full amount even when the container typically uses 200m CPU and 600 MiB.
Node dashboards may show low actual CPU usage, but the scheduler only sees allocatable capacity minus requested capacity. If the requested capacity is exhausted, new pods cannot be placed without a larger node, another node, or smaller requests.
Inflated requests connect directly to autoscaling problems. Larger pod requests create larger node demand. Fragmented requests leave unusable capacity behind. Small sizing errors multiply across shared enterprise clusters.
For example, a service that requests 1,000m CPU but uses 250m at p95 wastes about 750m of scheduled CPU per replica. Across 80 replicas, that is 60 vCPU of requested capacity the scheduler cannot give to other workloads. The cluster may scale out to meet the requested capacity even though node CPU utilization stays low:
| Symptom | Likely cause | Scheduling impact | Optimization action |
| Pods pending while node CPU looks low | Requests consuming allocatable capacity | The scheduler cannot fit new pods | Compare requested vs. used CPU and memory before adding nodes |
| Many small gaps across nodes | Fragmented requests | Free capacity is unusable for incoming pods | Rightsize requests and consolidate workload placement |
| Cluster Autoscaler adds nodes too often | Pod requests larger than real demand | Cluster Autoscaler reacts to scheduling pressure, not actual usage | Reduce inflated requests and recheck scale-out behavior |
| Namespace looks expensive but is quiet | Workloads requesting more than they use | Teams pay for capacity that workloads reserve but do not use | Identify and reduce waste by workload, namespace, and owner |
How Kubernetes Resource Limits Are Enforced at Runtime
Limits are enforced after scheduling by the kubelet and the underlying Linux kernel mechanisms. That means they protect runtime behavior, not placement behavior.
CPU and memory limits fail in opposite ways. When a container hits its CPU limit, the kernel throttles it. CPU is compressible, so Kubernetes slows the container down instead of killing it. Memory works differently. Memory is incompressible, so when a container exceeds its memory limit and the kernel cannot free enough, the kernel kills the container with an OOM kill.
The practical difference matters in production. CPU pressure usually causes latency, while memory pressure usually triggers a restart:
| Resource | Request role | Limit behavior | Failure mode | Recommended stance |
| CPU | Reserves schedulable CPU for placement | Throttles the container when exceeded | Latency, timeout, reduced throughput | Avoid CPU limits by default for latency-sensitive services; use accurate requests |
| Memory | Reserves schedulable memory for placement | Can kill the container when exceeded | OOM kill, restart, disruption | Set memory request and memory limit to the same value when possible, with a safe buffer based on realistic usage |
How Kubernetes Quality-of-Service (QoS) Classes Affect Eviction Behavior
When a node runs low on CPU or memory, Kubernetes has to decide which pods to evict first. Quality of Service (QoS) classes drive that decision. You never set a QoS class yourself. Kubernetes assigns one automatically from the requests and limits on each container in the pod.
This means a small YAML change, such as adding a memory request or matching requests and limits, can change how Kubernetes treats the pod during eviction. For a deeper discussion of eviction ordering, check our blog post on QoS classes.
Kubernetes has three QoS classes: Guaranteed, Burstable, and BestEffort. Guaranteed pods receive the strongest eviction protection because Kubernetes can clearly see a reservation and a cap. Burstable pods are not automatically safe, as their eviction risk depends on resource usage, requests, node pressure, and pod priority. BestEffort pods are the first eviction candidates since they have no reserved resources.
| QoS class | Configuration pattern | Eviction behavior | Risk to watch |
| Guaranteed | CPU and memory requests for each container equal its CPU and memory limits | Strongest eviction protection under pressure | Inflated values can overreserve capacity |
| Burstable | The pod has at least one CPU or memory request or limit, but not every container has matching requests and limits | More protected than BestEffort, less protected than Guaranteed | Low requests can leave the pod with too little CPU or memory when the node is busy |
| BestEffort | There are no CPU or memory requests or limits | First eviction candidate under node pressure | The pod is easy to deploy but unsafe for important workloads |
QoS classes help you understand eviction priority, but they do not prove a workload is sized correctly. A Guaranteed pod can still waste resources if requests are inflated. A Burstable pod can run well during normal periods but still suffer during contention if its requests are too low.
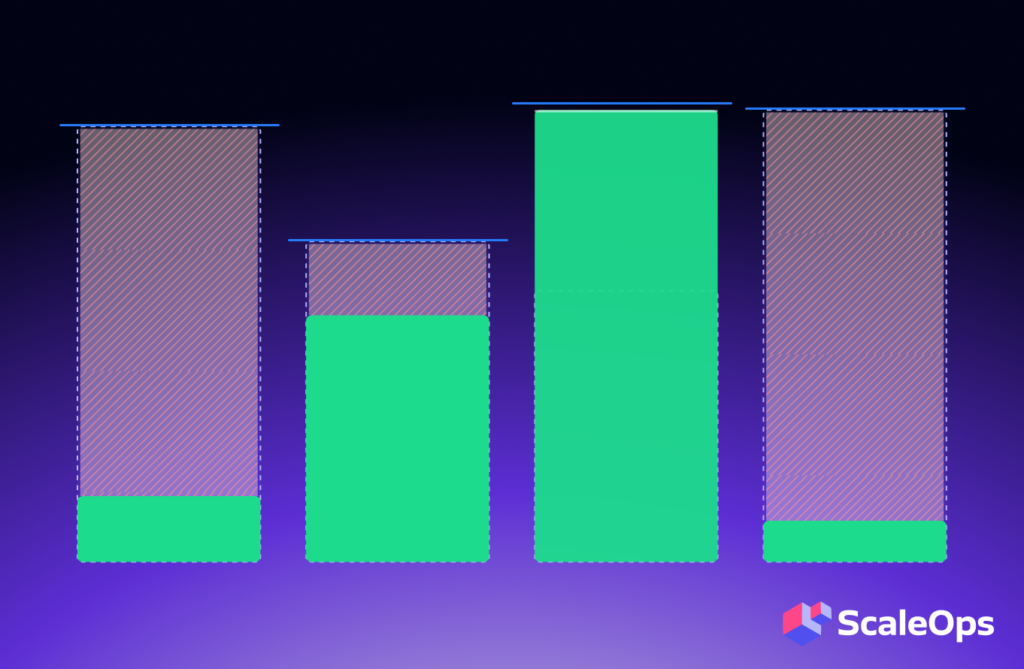
The Kubernetes Overprovisioning Trap: How Safety Margins Become Waste
Overprovisioning quietly drains cluster capacity, and it usually starts as a reasonable safety move. A service fails after a traffic spike, an OOM kill, or a migration, so the team raises CPU and memory settings to restore stability. The temporary fix then becomes permanent.
The trap appears because requests are copied into Helm charts, inherited by new services, and rarely revisited after the root cause is fixed. The cluster then carries the cost of yesterday’s emergency long after the risk has changed.
Common scenarios that lead to overprovisioning include copying resource settings from another service, sizing for rare peaks instead of realistic percentiles, inflating memory after unresolved OOM kills, adding CPU limits everywhere by policy, and treating namespace quotas as a substitute for workload-level sizing.
Overprovisioning also raises costs by weakening autoscaling efficiency. The scheduler must honor requested capacity, so inflated requests reduce the number of pods that fit on each node. Cluster Autoscaler then sees higher scheduling demand and may add nodes that real usage does not require. This is especially painful in enterprise clusters where many teams share infrastructure. A 100m CPU error looks small in one deployment, but across hundreds of services and thousands of replicas it becomes a major capacity problem.
ScaleOps pro tip
Use ScaleOps Automated Pod Rightsizing to manage requests in real time based on actual workload behavior, while preserving workload policies and rollout controls.
A Practical Methodology for Sizing Kubernetes Requests and Limits
Once you understand how overprovisioning occurs, the next step is keeping your Kubernetes requests and limits in line with workloads. This means replacing guesswork with a sizing process that repeats as traffic, code, dependencies, and runtime behavior change.
Observe real workload behavior
A practical workflow looks like this:
- Observe CPU, memory, restart, throttling, and OOM data over a meaningful window.
- Separate normal traffic, peak periods, deployments, and incidents.
- Use p95 or p99 rather than averages for production services.
- Set CPU requests from observed demand plus workload-specific headroom.
- Set memory requests and limits based on realistic memory usage with a safe buffer.
- Validate changes gradually and recheck after releases or traffic shifts.
Useful data sources include Prometheus, Metrics Server, kube-state-metrics, and application latency and error metrics. Each tells a different part of the story. Metrics Server provides basic CPU and memory visibility, while Prometheus provides richer historical trends. kube-state-metrics exposes requested resources and pod state. Application metrics tell you whether resource changes affected users.
Start by comparing requested CPU against actual usage:
sum by (namespace, pod) (
  kube_pod_container_resource_requests{resource="cpu"}
)
Choose the right percentile
Now look at how much CPU the workload actually uses. This query reads the 95th percentile of usage over the past seven days, grouped the same way as the requested-CPU query so the two line up side by side:
quantile_over_time(
  0.95,
  sum by (namespace, pod) (
    rate(container_cpu_usage_seconds_total{container!=""}[5m])
  )[7d:5m]
)
For memory, compare the requested memory with the working set and peak behavior:
max_over_time(
  container_memory_working_set_bytes{container!=""}[7d]
)
These queries are starting points, not a complete policy. The right buffer depends on how each service uses resources. A stateless internal API, a JVM service, a batch worker, and a cache-heavy workload each need different headroom and validation rules. This is why sizing decisions should treat CPU and memory differently, especially when deciding whether each resource needs a runtime limit.
In-place pod resizing in Kubernetes
Historically, changing a pod’s CPU or memory meant editing the spec and recreating the pod, which caused a restart. Kubernetes in-place pod resize, first introduced as alpha in v1.27 and graduated to beta in v1.33, is now stable in Kubernetes v1.35. It makes CPU and memory requests and limits mutable on running pods, so Kubernetes can change the underlying cgroup allocations without killing the container. This reduces the disruption of resizing stateful and latency-sensitive workloads, though it does not decide the right values on its own.
Kubernetes CPU Limits vs. Requests: CPU and Memory Stance
Treat CPU and memory as separate strategies. Avoid CPU limits by default for latency-sensitive services. Keep memory requests and limits closely aligned to reduce OOM risk.
For most latency-sensitive services, skip the CPU limit by default. A CPU limit can throttle a container even when the node has spare CPU, which turns idle capacity into latency, queue buildup, and timeouts. Keep CPU limits for the cases that need a hard ceiling: batch jobs, untrusted workloads, and strict multi-tenant isolation. Apply a limit because the workload needs a cap, not because a template includes one.
Handle memory more conservatively. For most workloads, set the memory request equal to the memory limit, or very close, with a buffer based on real usage. That gives Kubernetes an accurate scheduling signal and shrinks the gap between reserved memory and an OOM kill.
The Burstable QoS Gotcha: Why Low Throttling Can Still Hide Underrequested CPU
A pod can have a low CPU request and a higher CPU limit, which may look acceptable when the cluster is quiet. Low throttling can be misleading because the pod may still reserve less CPU than it needs once the node is under pressure.
Consider this Burstable pod configuration:
resources:
  requests:
    cpu: "100m"
    memory: "512Mi"
  limits:
    cpu: "500m"
    memory: "512Mi"
Assume the pod’s actual p95 CPU usage is 300m. Kubernetes reserved only 100m for scheduling, but the container will not be throttled until it reaches 500m. In a quiet cluster, the pod may run fine because spare CPU is available. Once the node gets busy, the pod may not get the CPU it needs, because Kubernetes reserved only 100m for it.
Requests must reflect real demand, not only the minimum CPU required to start the container. Requests, limits, QoS, and runtime signals can point in different directions because each measures a different part of resource behavior:
- Requests tell Kubernetes what to reserve.
- Limits define runtime ceilings.
- QoS describes eviction priority.
- Runtime metrics show what the container actually used.
This leads to a set of misleading signals:
| Misleading signal | How to get a better signal |
| Low throttling | Compare requests to actual p95 CPU usage |
| Low average CPU | Inspect p95 and p99 usage |
| No OOM kills | Inspect memory headroom and restart trends |
| Low node utilization | Compare requested vs. used capacity |
| Burstable QoS | Check whether requests actually match production demand |
Treat each signal as a clue. A pod can avoid throttling and still be underrequested. It can avoid OOM kills and still have very little memory headroom. A node can look idle and still be out of schedulable capacity.
This is where namespace-level guardrails become useful. They do not tell you the right size for each workload, but they can prevent the most dangerous defaults, missing requests, and extreme limits while teams improve workload-level sizing.
Namespace Guardrails: Using LimitRange and ResourceQuota Without Replacing Rightsizing
Namespace guardrails help prevent extreme or missing resource settings in shared clusters. They prevent pods with no requests, prevent extreme limits, and protect shared clusters from one team consuming all schedulable capacity.
A LimitRange can set default, minimum, and maximum resource values inside a namespace. It can prevent pods from being created without requests or with extreme limits:
apiVersion: v1
kind: LimitRange
metadata:
  name: default-container-resources
  namespace: payments
spec:
  limits:
  - type: Container
    defaultRequest:
      cpu: "200m"
      memory: "256Mi"
    default:
      memory: "512Mi"
    min:
      cpu: "50m"
      memory: "128Mi"
    max:
      cpu: "2"
      memory: "2Gi"
A ResourceQuota caps total namespace consumption. It helps protect a shared cluster from one team consuming all schedulable capacity:
apiVersion: v1
kind: ResourceQuota
metadata:
  name: payments-quota
  namespace: payments
spec:
  hard:
    requests.cpu: "20"
    requests.memory: "80Gi"
    limits.memory: "120Gi"
    pods: "200"
Guardrails enforce policy boundaries, which is useful for platform safety, but they do not observe workload behavior and cannot size workloads correctly on their own. A default request may be better than no request, but it is still a guess until you compare it with real usage.
Troubleshooting Kubernetes Requests and Limits
Guardrails and a sizing methodology reduce mistakes, but you will still need to diagnose workloads that misbehave in production. A few commands tell you quickly whether requests and limits are the cause.
Start with live usage. kubectl top pod shows current CPU and memory use per pod, which you can compare against the requests and limits in the spec. A pod sitting far below its requests points to overprovisioning. A pod pinned near its CPU limit points to throttling.
Inspect the pod state next. kubectl describe pod <pod-name> reports the QoS class, the configured requests and limits, recent events, and the last termination reason. Two reasons matter most here:
- OOMKilled means the container exceeded its memory limit and the kernel stopped it. Raise the memory limit to match real usage with a buffer, or track down the leak.
- CrashLoopBackOff means the container keeps restarting. Repeated OOMKilled events are a common cause, so check the last termination reason before assuming a code bug.
For CPU, check the container’s throttling metrics. A high ratio of throttled periods alongside low CPU usage means the CPU limit is too tight for the workload’s bursts, even when the node has spare CPU. That is the signal to raise or remove the CPU limit for a latency-sensitive service.
How ScaleOps Automates Rightsizing for Kubernetes Requests and Limits
ScaleOps steps in where Prometheus falls short. Manual Prometheus analysis can identify improper settings, but it does not continuously close the loop. Someone still has to review dashboards, change YAML, coordinate rollout safety, and revisit the same workload after the next release or traffic shift.
ScaleOps automates that loop by observing actual workload behavior and managing Kubernetes requests and limits for CPU and memory in real time. It also works with Horizontal Pod Autoscaler (HPA) and Kubernetes Event-driven Autoscaling (KEDA) rather than replacing horizontal scaling. The goal is to keep pod sizing aligned with demand while preserving reliability controls and rollout safety:
| ScaleOps capability | How it supports requests and limits |
| Automated Pod Rightsizing | Manages requests and limits for CPU and memory based on workload behavior |
| Policy and rollout controls | Applies changes safely instead of forcing manual YAML edits everywhere |
| Autoscaler alignment | Coordinates pod rightsizing with HPA and KEDA so request changes do not trigger unstable scale-up or scale-down |
Automation matters because requests that matched a workload last month can become too high, too low, or unsafe after a release or traffic shift, which is why pod rightsizing fails in production when teams rely on manual tuning. ScaleOps keeps these settings aligned with real usage automatically, without every team reviewing dashboards and editing YAML by hand.
Conclusion: Treat Kubernetes Requests and Limits as an Operating Discipline
Requests decide how pods are scheduled and how much capacity the cluster reserves. Limits determine how containers behave when runtime usage crosses a threshold. Getting both right is a continuous process that affects cost, latency, stability, autoscaling, and eviction behavior.
The main recommendations are clear:
- Set CPU requests based on real p95 or p99 demand, plus service-specific headroom.
- Avoid CPU limits by default for latency-sensitive production services unless you need a hard cap.
- Keep memory requests and limits close, often even equal, since a memory failure is disruptive.
- Use QoS classes and namespace guardrails deliberately, but do not treat them as substitutes for workload-level sizing.
As your environment grows, manual tuning becomes too slow and inconsistent. ScaleOps Automated Pod Rightsizing keeps Kubernetes requests and limits aligned with real workload behavior while maintaining rollout safety and policy controls.
Book a ScaleOps demo to see how automated rightsizing reduces waste, improves scheduling efficiency, and makes Kubernetes resource management easier to operate at scale.
Kubernetes Requests and Limits: Frequently Asked Questions
What is the difference between CPU requests and limits in Kubernetes?
CPU requests are the amount of CPU capacity Kubernetes reserves for scheduling. CPU limits are runtime ceilings that throttle the container when exceeded. A low CPU request can leave the pod with too little CPU when the node gets busy, even when throttling looks low.
Why should the memory request be equal to the memory limit in Kubernetes?
Memory cannot be compressed the way CPU can be throttled. If a container uses more memory than its limit allows, Kubernetes may kill and restart it. Setting the memory request equal to the memory limit gives Kubernetes a more realistic scheduling signal and shrinks the gap between reserved memory and runtime failure.
What happens if a Kubernetes pod exceeds its CPU limit?
The container is throttled, usually showing up as higher latency, slower processing, lower throughput, or more timeouts. The container normally keeps running, but performance degrades.
What happens if a Kubernetes pod exceeds its memory limit?
Kubernetes may terminate the container with an OOM kill. This usually causes a restart and service disruption, which is why memory sizing should be based on realistic usage, headroom, and restart history rather than averages alone.
Should every Kubernetes workload have CPU limits?
No. CPU limits should not be the default for most latency-sensitive production services. They make sense for batch jobs, untrusted workloads, strict multi-tenant isolation, and intentionally capped workloads. For many services, accurate CPU requests without CPU limits give better burst behavior.